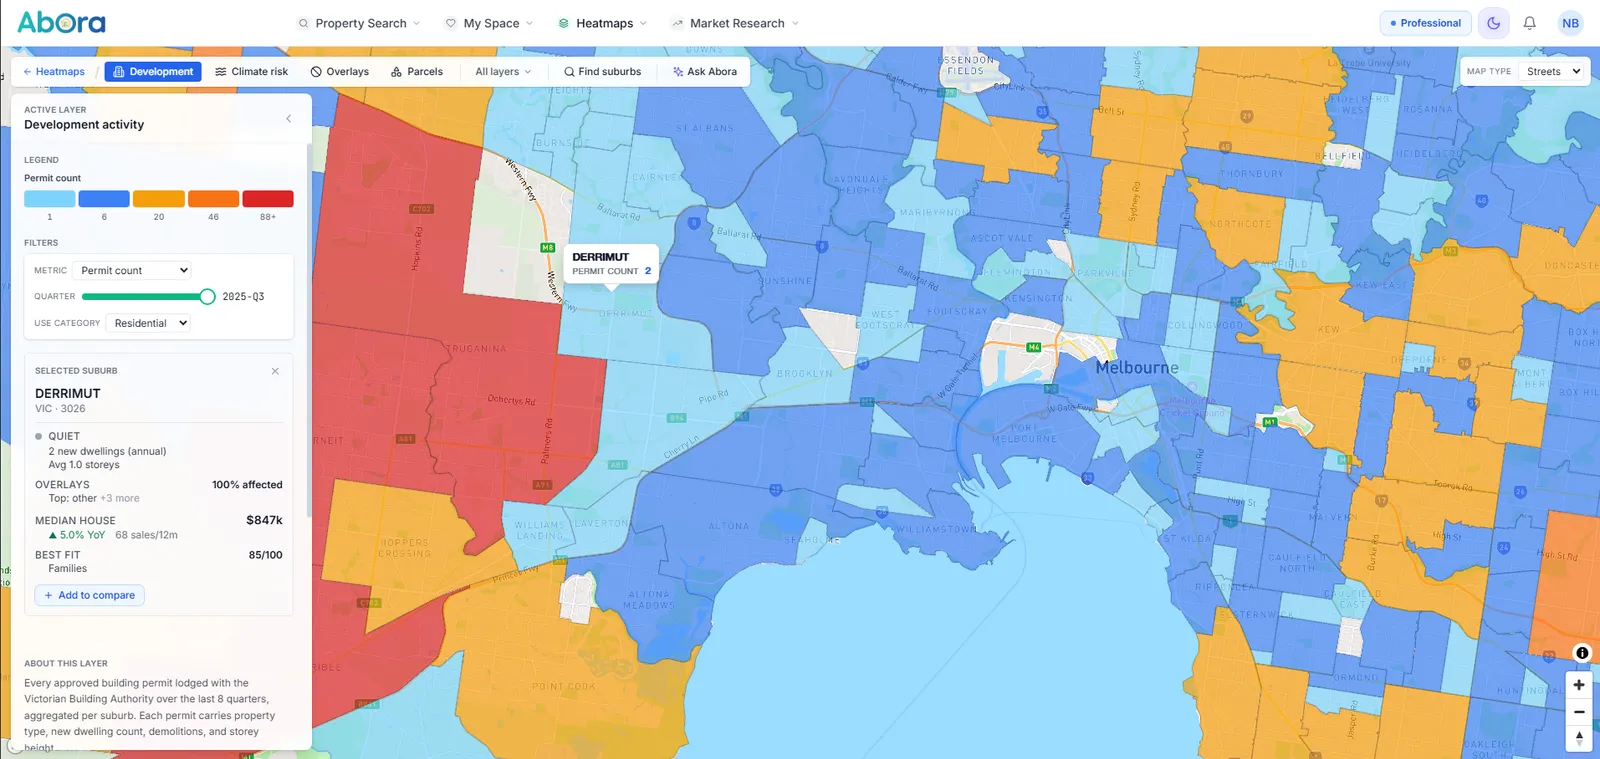
Development activity, 2025-Q3, residential permits. Red is 88+ approved permits in the quarter.
4.1MRegistered parcels behind the boundary layer
8Quarters of permit history you can step through
4Overlay families checked for climate risk
FreeDevelopment activity on a free account
Six layers, six questions
Each layer answers one thing, and one renders at a time. Switch between them in a click to build a picture of a suburb.
Development activityFree account
Where are the cranes going up?
Every approved building permit lodged with the Victorian Building Authority over the last eight quarters, aggregated per suburb. Each permit carries property type, new dwelling count, demolitions and storey height.
What you can do with it
Step through quarters to see how development has accelerated or cooled
Filter by property type to focus on residential infill or commercial activity
Spot transforming suburbs — those flipping from quiet to active in a year or two
Compare construction intensity between suburbs side by side
What it measures
Permit countApproved permits in the selected quarter
New dwellingsTotal dwelling additions across all permits
DemolitionsBuildings flagged for removal
Median storeysVertical density signal — taller means denser builds
Filters
Quarter — a time slider over the last eight quarters. Use category — residential, commercial, mixed-use, industrial.
Source
Victorian Building Authority · refreshed quarterly
Best for
Investors after early growth signals · buyers avoiding construction-heavy streets · anyone tracking infill against greenfield
Climate riskFree account
Will it flood, or burn?
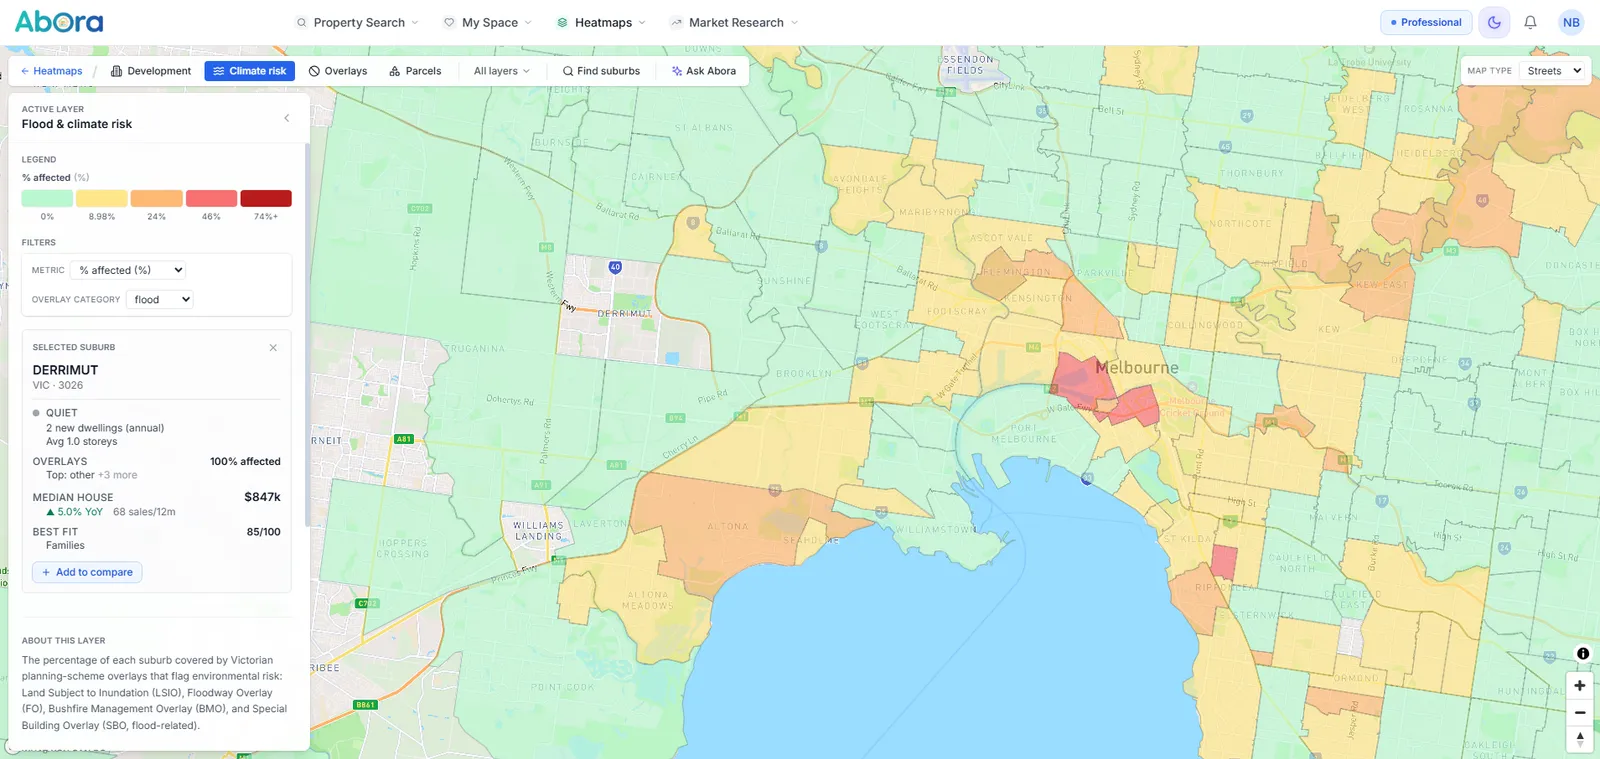
The share of each suburb covered by Victorian planning-scheme overlays that flag environmental risk: Land Subject to Inundation (LSIO), Floodway Overlay (FO), Bushfire Management Overlay (BMO) and Special Building Overlay (SBO).
What you can do with it
Filter to a single hazard — flood, bushfire, contamination — to see which suburbs are most exposed
Pre-screen a shortlist by removing high-exposure suburbs before you spend a Saturday on inspections
Compare overlay coverage across councils to understand regional risk patterns
Check a listing’s “no flood history” claim against the actual planning overlays
What it measures
Total affected %Combined area under any climate-risk overlay
Flood %Area in LSIO, FO or SBO overlays
Bushfire %Area in the BMO overlay
Top overlayThe single overlay with the largest coverage in the suburb
Buyers screening for insurance and lender exposure · anyone buying near a river, creek or the bushland fringe
Easements & overlaysPro
What's hiding in the title?
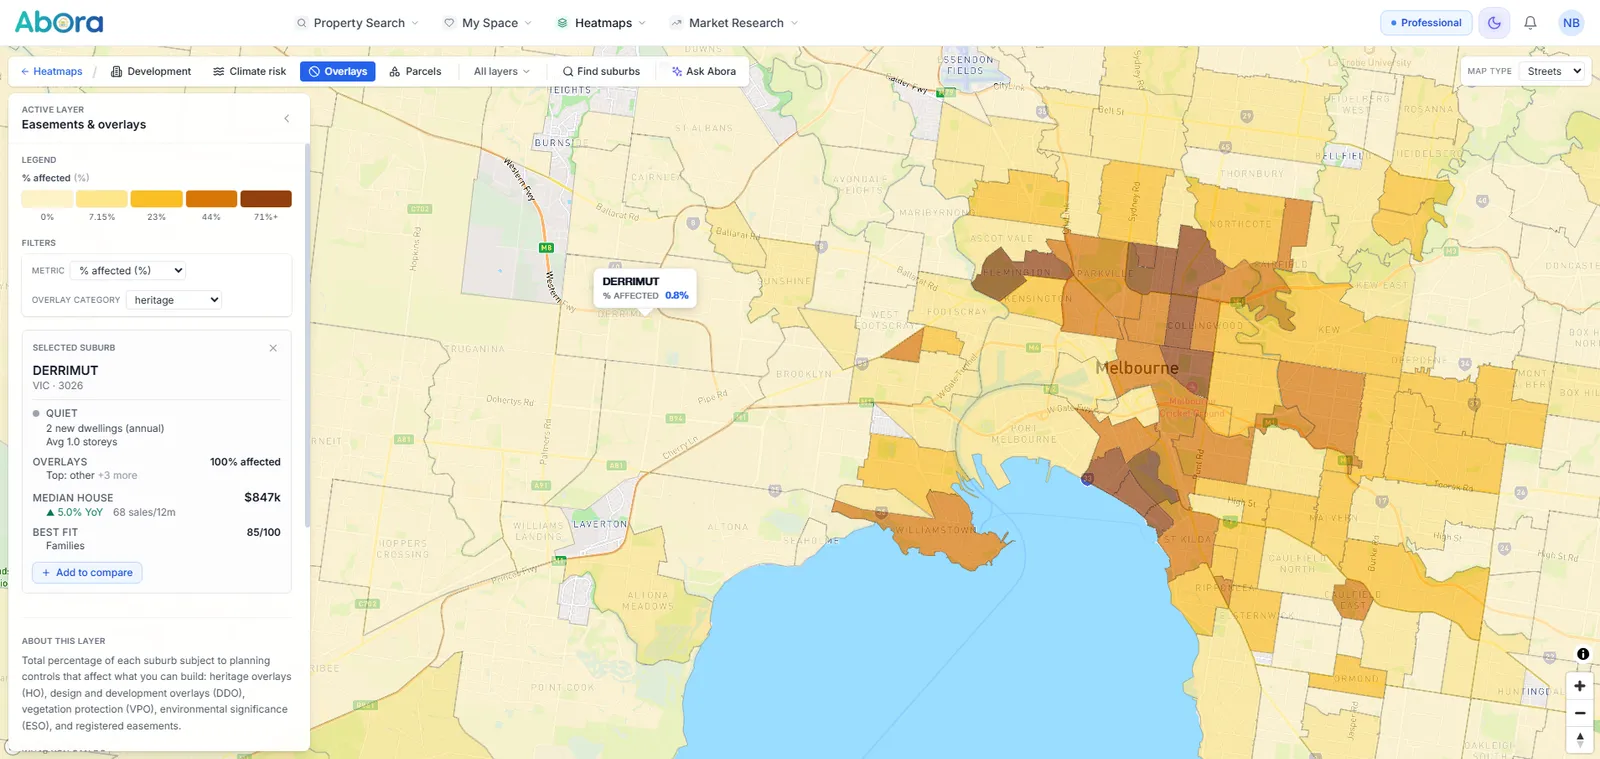
The share of each suburb under planning controls that affect what you can build: heritage overlays (HO), design and development overlays (DDO), vegetation protection (VPO), environmental significance (ESO), and registered easements.
What you can do with it
Find the suburbs with heavy heritage restrictions before you fall for a Victorian terrace
Identify development-friendly suburbs with few overlay constraints
Filter by category to focus on heritage, vegetation or design controls
Spot suburbs where easements eat into usable land
What it measures
Total overlay %Aggregate planning-constraint coverage
Top overlayMost common constraint type in the suburb
Categories affectedDistinct overlay families touching the suburb
Easement coverageShare of suburb area under registered easements
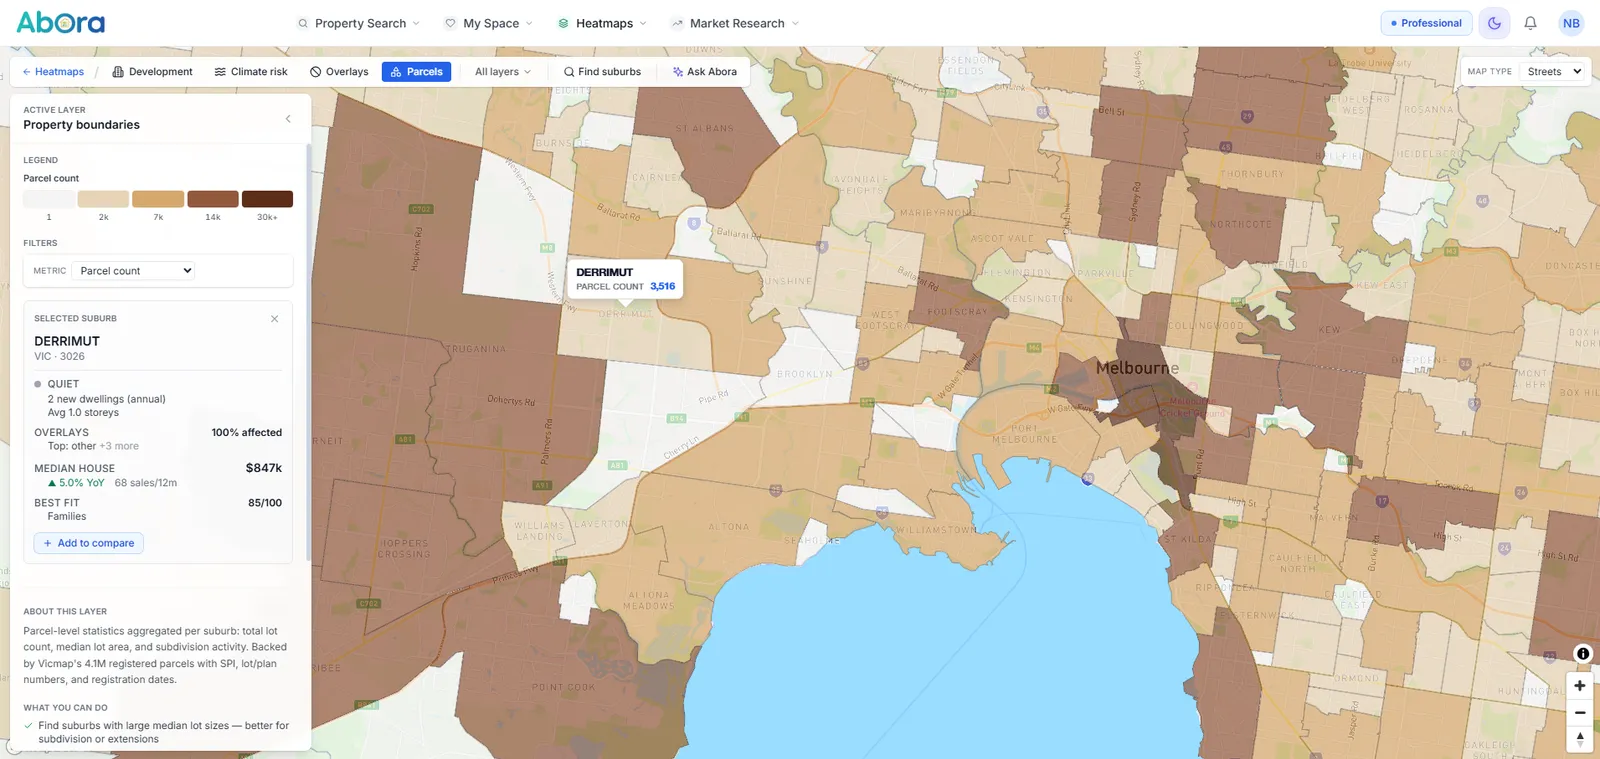
Parcel-level statistics aggregated per suburb: total lot count, median lot area and subdivision activity — backed by Vicmap’s 4.1 million registered parcels, with SPI, lot and plan numbers and registration dates.
What you can do with it
Find suburbs with large median lot sizes — better for subdividing or extending
Compare lot density between leafy and dense suburbs
Spot recently registered subdivisions through plan-of-subdivision activity
Pre-screen for the street fabric you want — quarter-acre against unit block
What it measures
Parcel countTotal registered parcels in the suburb
Median lot areaHalf of all lots are bigger than this, in m²
Plan type mixLP (pre-1980s established) against PS (modern subdivisions)
Filters
None — the layer renders one measure at a time.
Source
Vicmap · refreshed quarterly. New subdivisions can lag one to two quarters.
Best for
Developers looking for subdivision opportunities · buyers who want room to extend · anyone comparing block sizes across councils
Planning zonesNot built yet
What can go here?
Zoning composition per suburb — what proportion is zoned residential (NRZ, GRZ, RGZ), commercial (C1Z, C2Z), industrial (IN1Z, IN3Z), mixed-use (MUZ) and special use (SUZ).
What you will be able to do
Identify upzoning opportunities — suburbs whose zone mix is shifting over time
Tell purely residential streets from mixed-use precincts
Compare zone diversity across councils to read strategic planning direction
Screen for Residential Growth Zone corridors near transport hubs
What it will measure
Dominant zoneLargest zone category by area
Zone diversityHow many distinct zones the suburb spans
Restrictive %NRZ and heritage-zoned proportion, which limits density
Not built yet. The zoning data exists in Vicmap and the layer is specified — it is not in Map Studio today. Everything above describes what it will do, not what it does.
Transit & connectivityNot built yet
How well-connected is it?
Public transport accessibility per suburb, from PTV train, tram and bus stop density, distance to major hubs, and walkability.
What you will be able to do
Find well-connected suburbs without paying inner-city prices
Identify suburbs near upcoming infrastructure — level-crossing removals, new stations
Check a listing’s “five minutes to the station” against actual PTV data
Compare transport scores between candidate suburbs side by side
WalkabilityWalk score from amenity and transit proximity
Distance to hubStraight-line distance to the nearest major hub
Not built yet. PTV and OpenStreetMap both publish the inputs, and the layer is specified — it is not in Map Studio today. Everything above describes what it will do, not what it does.
How it works
Pick a layer, step through the quarters, read a suburb.
3 min
More than a coloured map
Three panels sit alongside the map. They are the difference between looking at data and asking it something.
Suburb ResearcherAsk the mapA conversational agent that drives the map for you. Ask for suburbs matching a set of conditions in plain English and it runs the query, then highlights what it found.
Multi-criteria searchFind suburbsStack criteria row by row — layer, metric, operator, value — and every suburb that matches is highlighted while the rest dim back. Useful when you already know your thresholds.
Up to 3 at onceCompare side by sidePut up to three suburbs in one sheet, with the best and worst value on each key metric called out. The columns use identical axes, so the differences are real rather than scale tricks.
Who uses it
Investors looking for growth signals before they show up in prices.
Buyers checking what is being built nearby before they commit.
Anyone buying near a river, a creek or bushland.
Start with a free account
Development activity is free to explore across every Victorian suburb. No card, no trial clock.
Not yet. Every layer is Victorian, because the state's open data is the most complete in the country and we would rather cover one state properly than five badly.
Is it suburb-level or property-level?
Heatmaps are suburb aggregates — they answer "which places", not "which house". For a single address, Property X-Ray reads the parcel itself and is free.
How current is the permit data?
Quarterly, from the Victorian Building Authority, covering the last eight quarters. New subdivisions can lag a quarter or two behind registration.
Does "no overlay" mean there is no risk?
No. It means nothing is recorded in the planning scheme. In older subdivisions and outside metro Melbourne, a constraint can exist without a mapped overlay.
Do I need to pay for this?
You need a free account, not a card. The development and climate-risk layers are on the free plan; the rest come with Professional.
Where does the data actually come from?
Vicmap for planning overlays, parcels and easements — the state’s own spatial dataset, the same one councils and conveyancers work from — and the Victorian Building Authority for permits. Each layer states its own refresh date in the app.
Can I decide whether to buy from this?
No, and it is not built to be used that way. These are suburb-level aggregates of published government data: useful for narrowing where to look, not a substitute for a property report, a building inspection or a conveyancer reading the contract.
Sources
Victorian Building Authority (building permits) · Vicmap (planning overlays, parcels, easements). Each layer states its own refresh date in the app. How we handle data →
Heatmap Studio presents published government data as suburb-level aggregates. It is not financial, legal or planning advice, and it is not a substitute for a property report, a building inspection or a conveyancer’s due diligence. Overlay coverage is indicative and current as at each layer’s stated refresh date.