Free · No sign-up · A projection, not a forecast
Capital Growth & Equity Calculator
Project a property's value and your equity over five, ten or twenty years at a growth rate you choose, and see how compounding growth combines with the loan paying down over the same period. Three scenarios, so the downside is visible too.
- 20 yrValue and loan, year by year
- 3Scenarios including the downside
- YoursYou choose the growth rate

The property
Assumes a standard 30-year principal and interest loan paying down alongside the growth.
Twenty years
Equity is the gap between the two lines
- Property value
- Loan balance
Every five years
The same projection, in numbers
| When | Value | Loan | Equity |
|---|---|---|---|
| Today | $985,000 | $788,000 | $197,000 |
| Year 5 | $1,227,489 | $735,057 | $492,432 |
| Year 10 | $1,529,675 | $662,932 | $866,743 |
| Year 15 | $1,906,253 | $564,672 | $1,341,581 |
| Year 20 | $2,375,538 | $430,810 | $1,944,728 |
If it goes differently
Ten years, three ways
The same property with the assumptions moved. This is the honest range, and the gap between the first and last card is the part worth sitting with.
- Base case$866,7434.5% growth · 6.20% rate
- Low growth$597,9512.5% growth (−2%)
- High interest$835,5894.5% growth · 8.20% rate
Growth is not evenly spread across a city. What a specific suburb has actually done, and what is being built in it, tells you more than any single average.
Read this before the number
A smooth curve is the most persuasive shape in property
Compounding a growth rate forward is arithmetic, and arithmetic always produces a tidy line. Real property does not move that way — it jumps, then does nothing for years. The projection is still worth doing, as long as you read it for what it is.
- Two things build equityThe value going up, and the loan coming down. The second one is certain if you keep paying; the first one is not. Over twenty years both matter roughly equally.
- The rate is an assumptionA long-run average is the least bad starting point available, but it is not a prediction about your property, your suburb, or the next twenty years.
- These are future dollarsNothing here is adjusted for inflation. A million dollars in twenty years does not buy what a million buys today, and the projection makes no attempt to pretend otherwise.
The growth rate is the whole projection
Change it by two points and the twenty-year figure moves by hundreds of thousands. Rather than guessing, look at what a specific suburb has actually done — how it has sold, what is being approved nearby, and who is moving in.
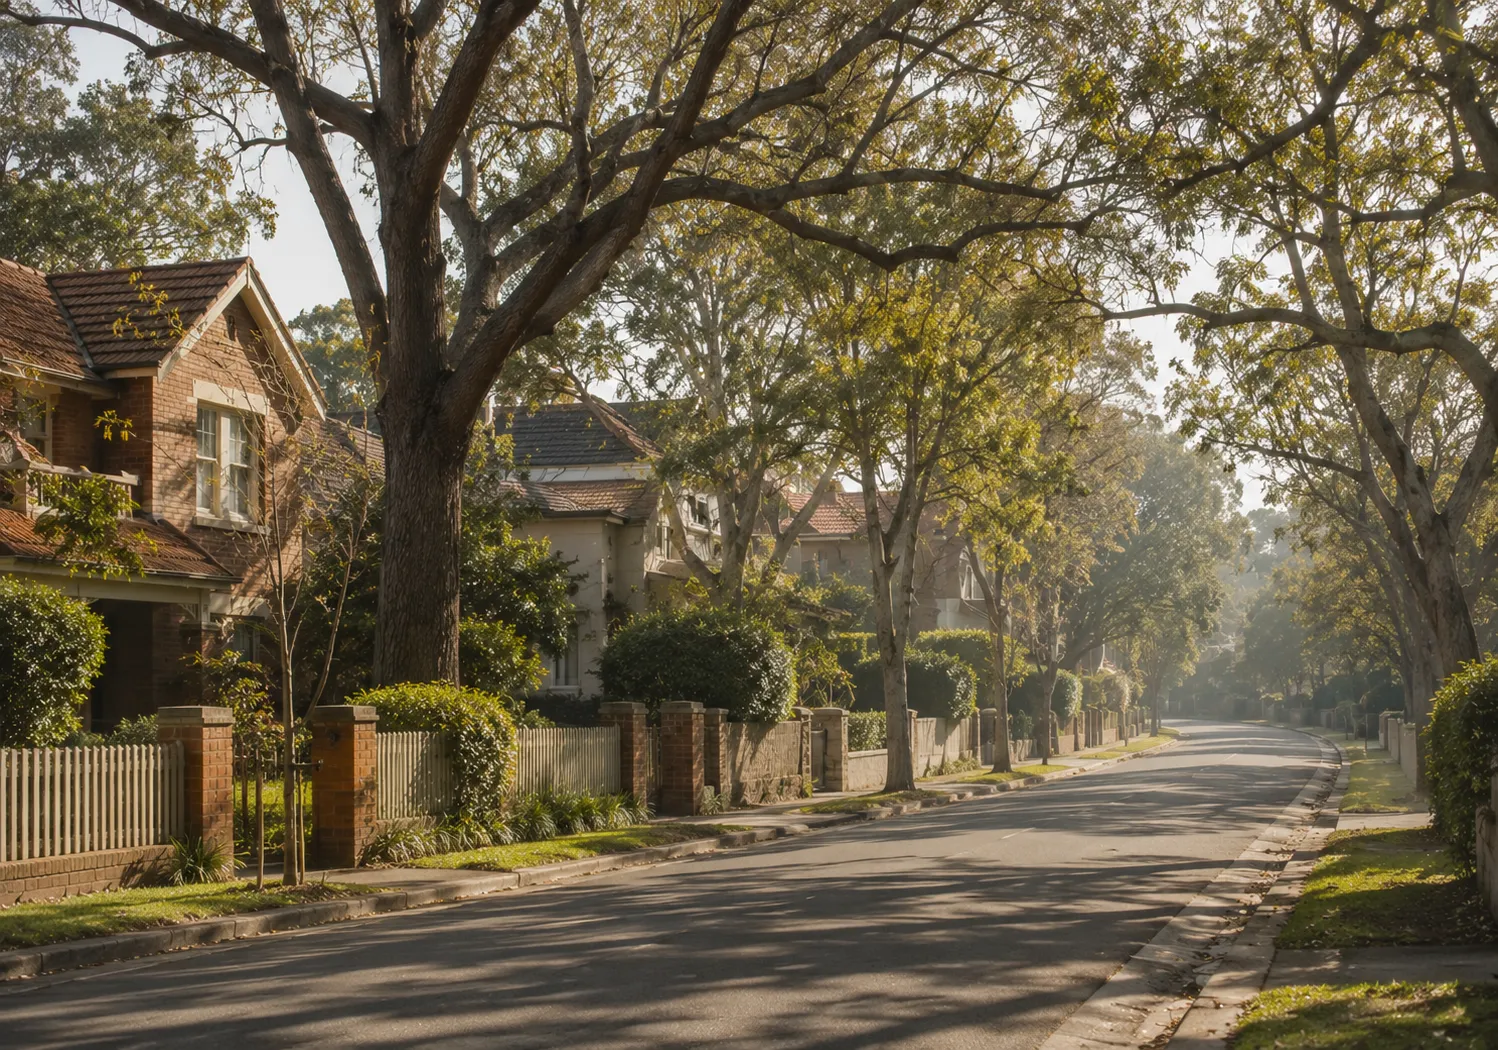
What moves the number
What actually drives the line
Growth is not spread evenly across a city, or across time. Three things separate the places that compound from the places that stall.
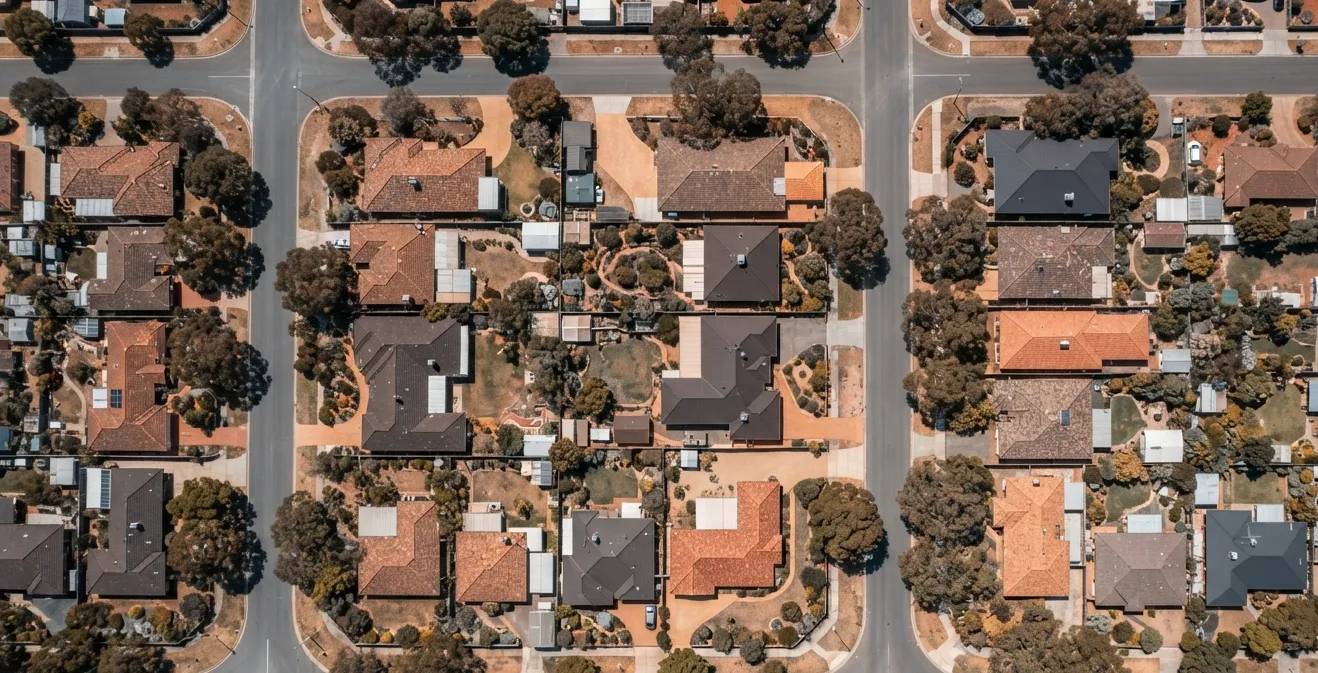 Land, not buildingBuildings depreciate; land appreciates. Two properties at the same price can hold very different amounts of land, and over twenty years that difference tends to show up in the value.The durable part
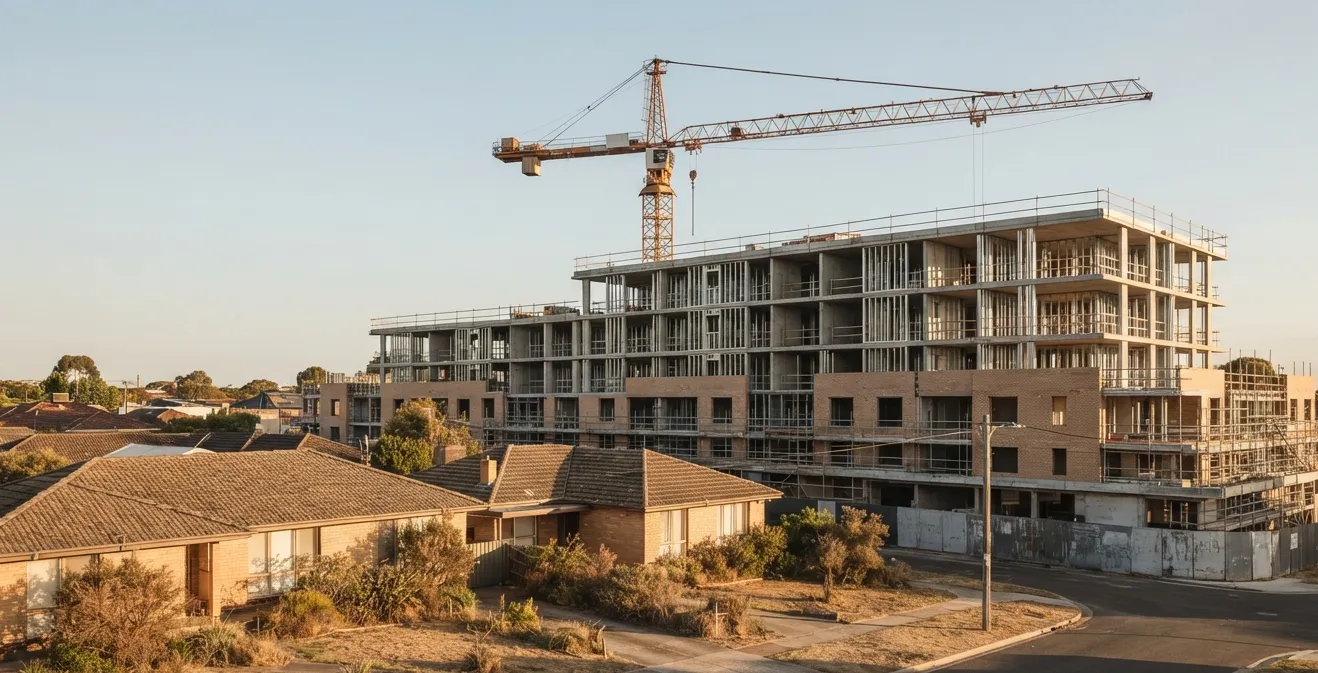 What gets built nearbyRezoning, a new station or three towers at the end of the street change a suburb over exactly the period this projection covers. Some of that lifts values and some caps them, and it is knowable in advance.Twenty years is long
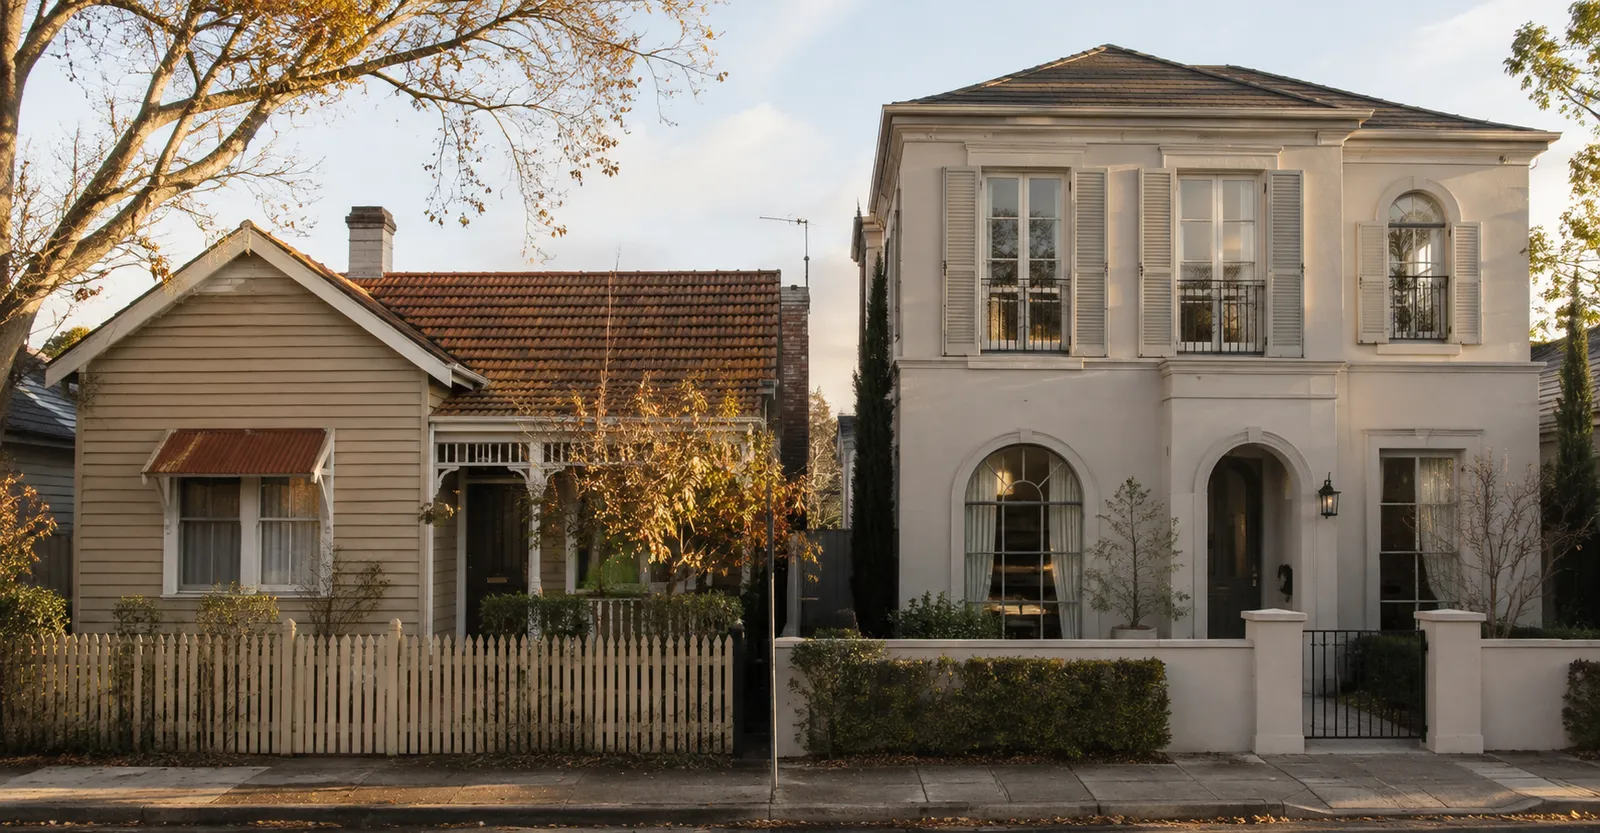 Time in, not timingMost of the growth in a twenty-year hold arrives in a handful of short bursts nobody calls in advance. Holding through the flat stretches is what captures them, which is why cash flow and capital growth are the same conversation.Bursts, then nothing
From Market Pulse
Guides that go deeper
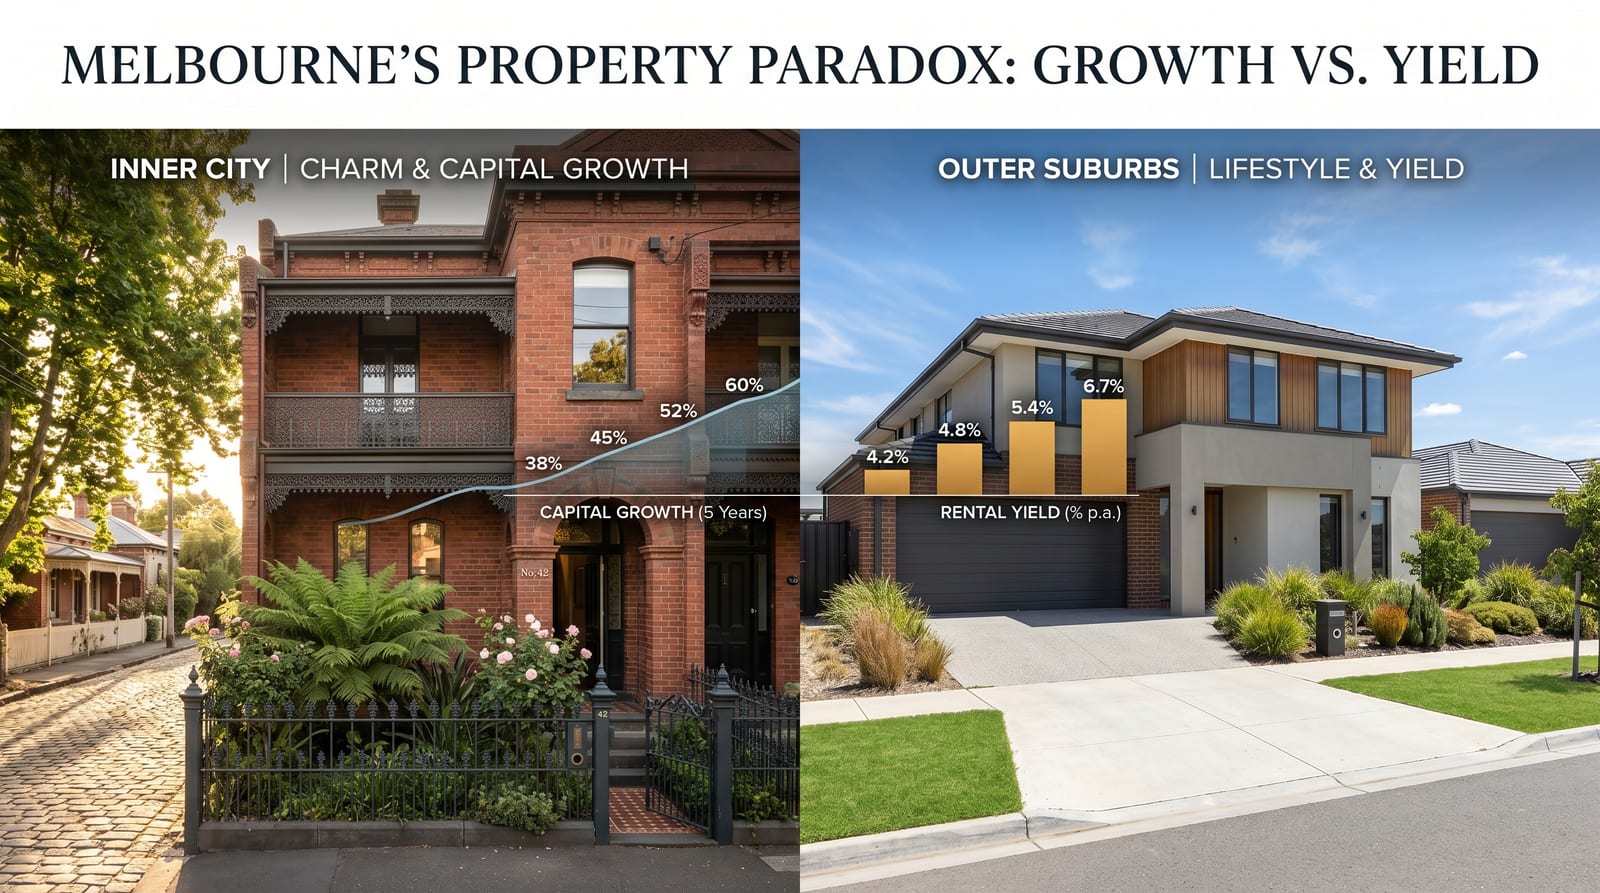 Investor Playbooks
Capital growth vs rental yield Melbourne: what the 2026 data says
Chasing capital growth or rental yield in Melbourne? We break down the trade-offs, the 2026 suburb data, and the tax risks every investor needs to model before buying.
 Market Pulse Comparisons
Tarneit vs Point Cook 2026: which western suburb wins for investors?
Tarneit vs Point Cook 2026 head-to-head: median prices, rental yield, West Tarneit Station, demographics and infrastructure to find which western Melbourne suburb wins.
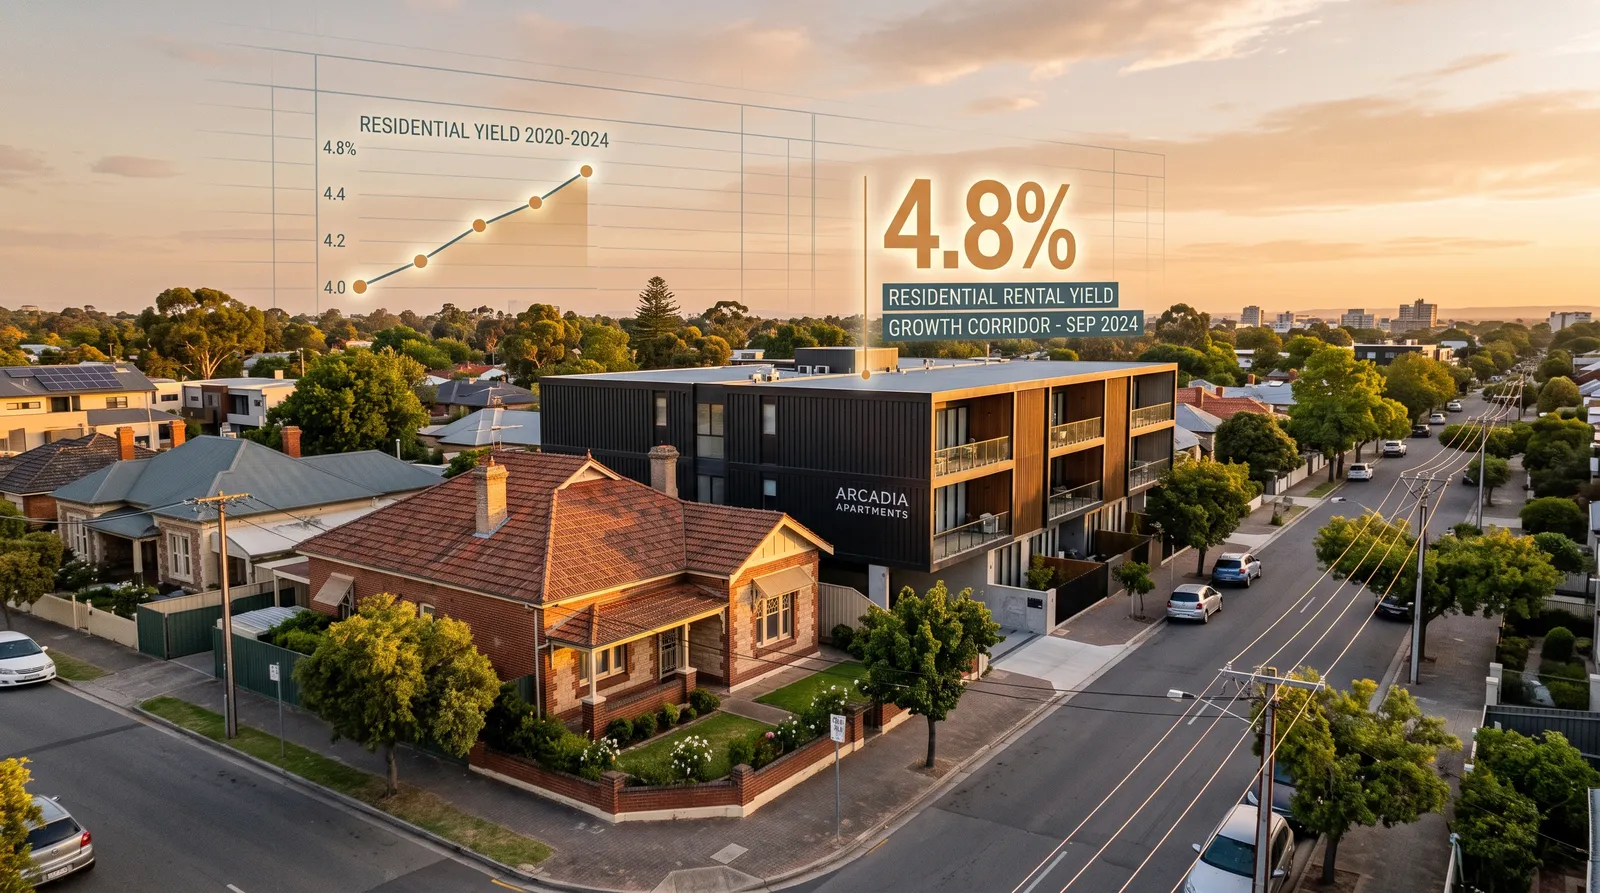 Investor Playbooks
Is 4% a good rental yield? 2026 Australian benchmarks by city
Gross yields run from ~3.2% in Sydney to 6% in Darwin, and units beat houses by 1–1.5 points. 2026 benchmarks and the yield you need for positive cash flow.
Keep going
The rest of the sums
What the projection assumes
Value compounding evenly at the rate you choose, and a 30-year principal and interest loan paying down alongside it at the rate you set. See our methodology.
What it leaves out
Buying and selling costs, stamp duty, capital gains tax, renovations, redraw and extra repayments. No figure here is adjusted for inflation.
Why the downside is shown
Because a single line is the easiest thing in property to believe. The three scenarios are the same property with the assumptions moved, and the spread between them is the honest answer.

The other half of the return
Growth is what it becomes. Yield is what it pays you meanwhile.
A projection twenty years out only matters if you can comfortably hold the property for twenty years. Cash flow is what decides that, and the two are usually in tension.
A projection, not a prediction. This calculator compounds a growth rate you choose and is not financial or investment advice, a valuation, or a forecast of any property or market. Past growth does not indicate future growth, and real property values move irregularly rather than at a steady annual rate. Figures are in future dollars with no inflation adjustment, and exclude transaction costs, capital gains tax, land tax and any work done to the property. Confirm anything that decides a purchase with your accountant or a licensed adviser.