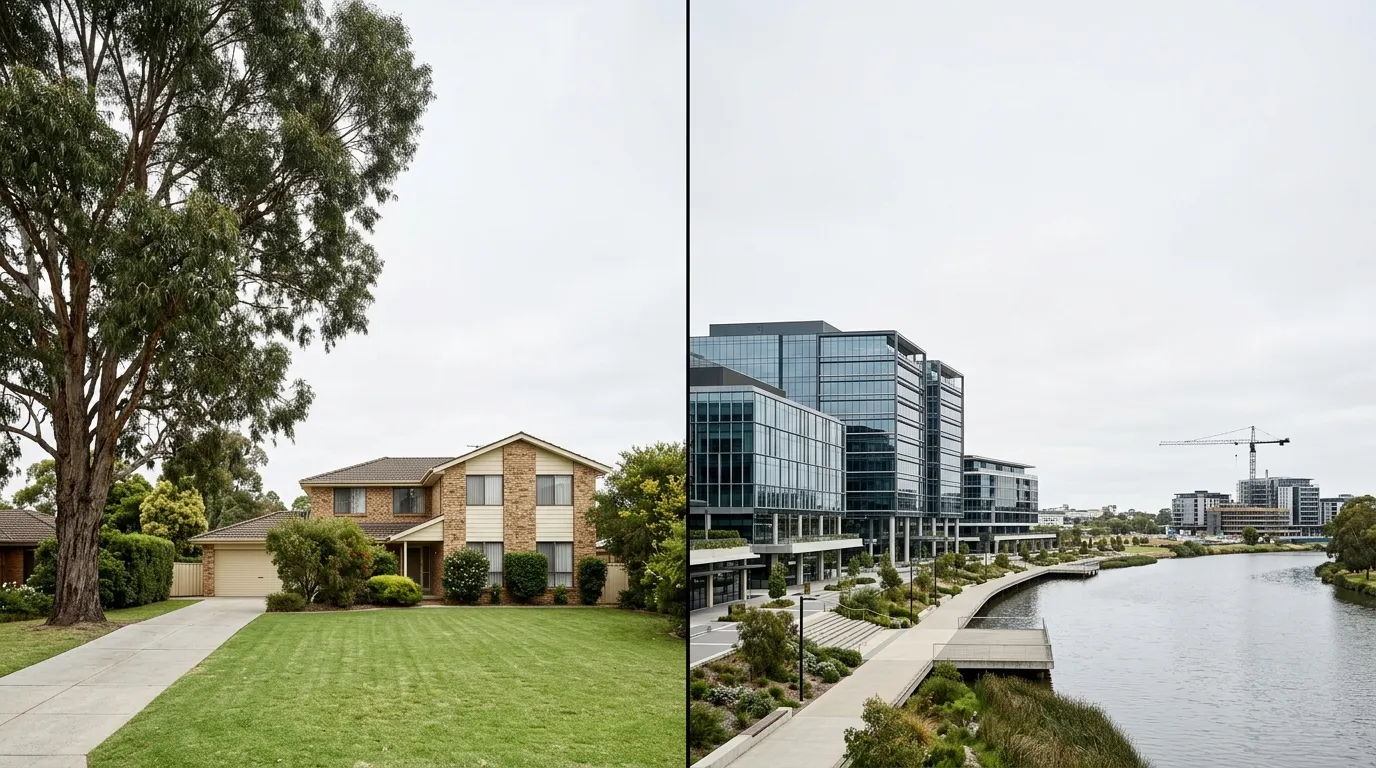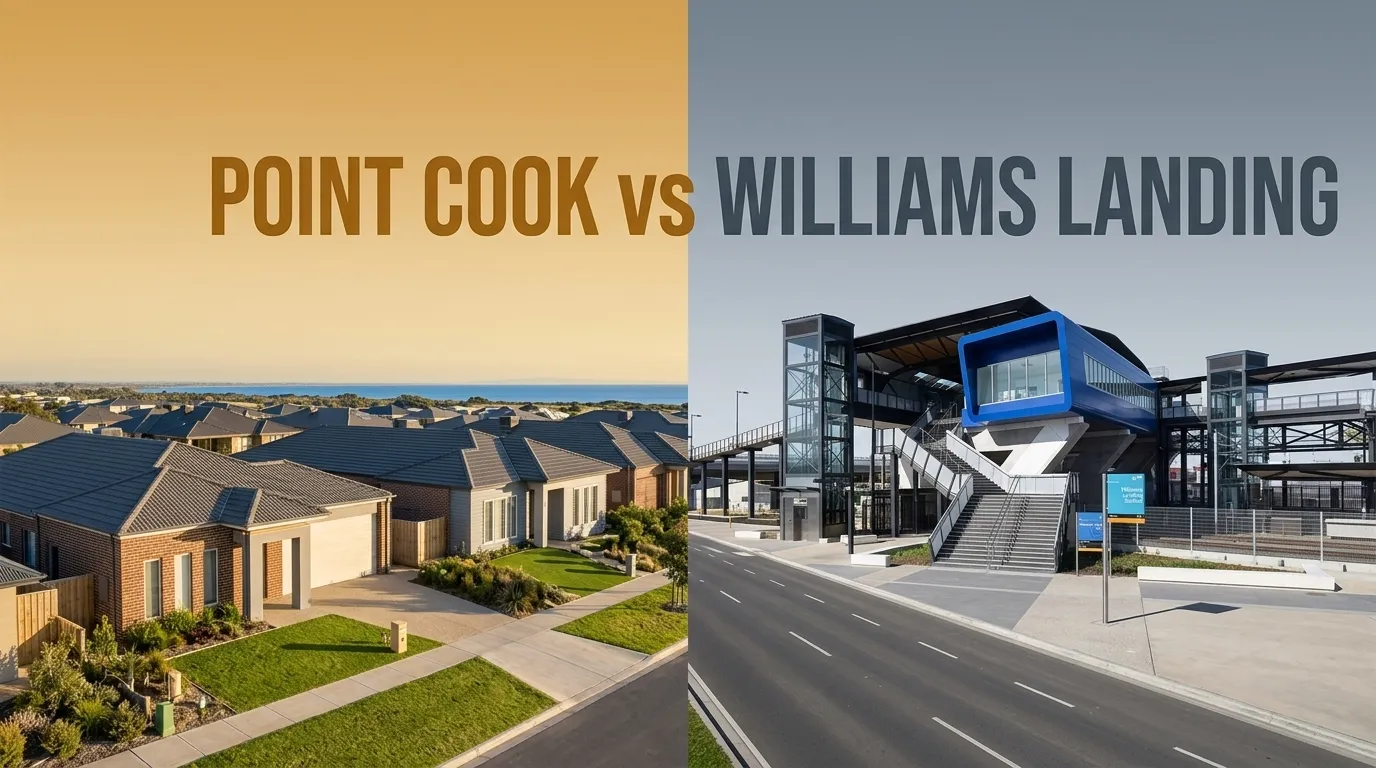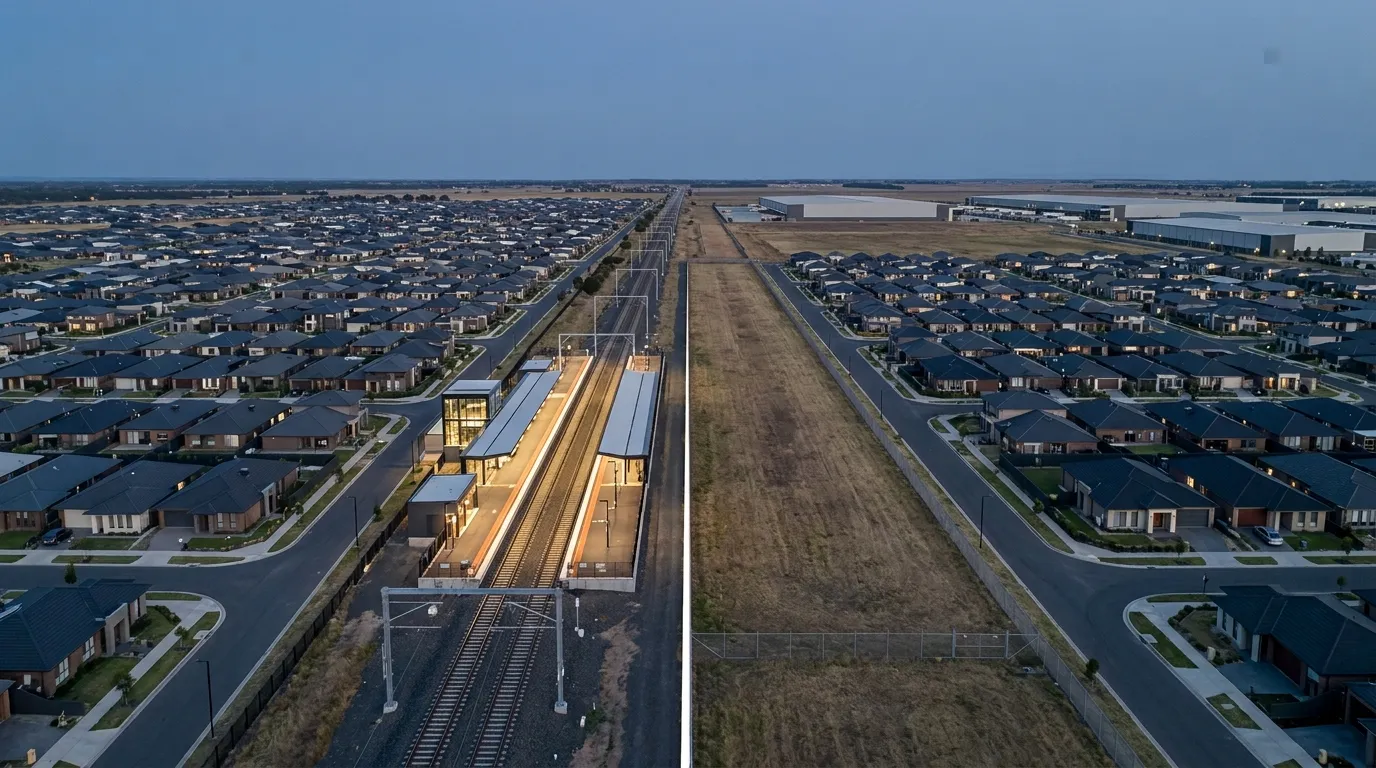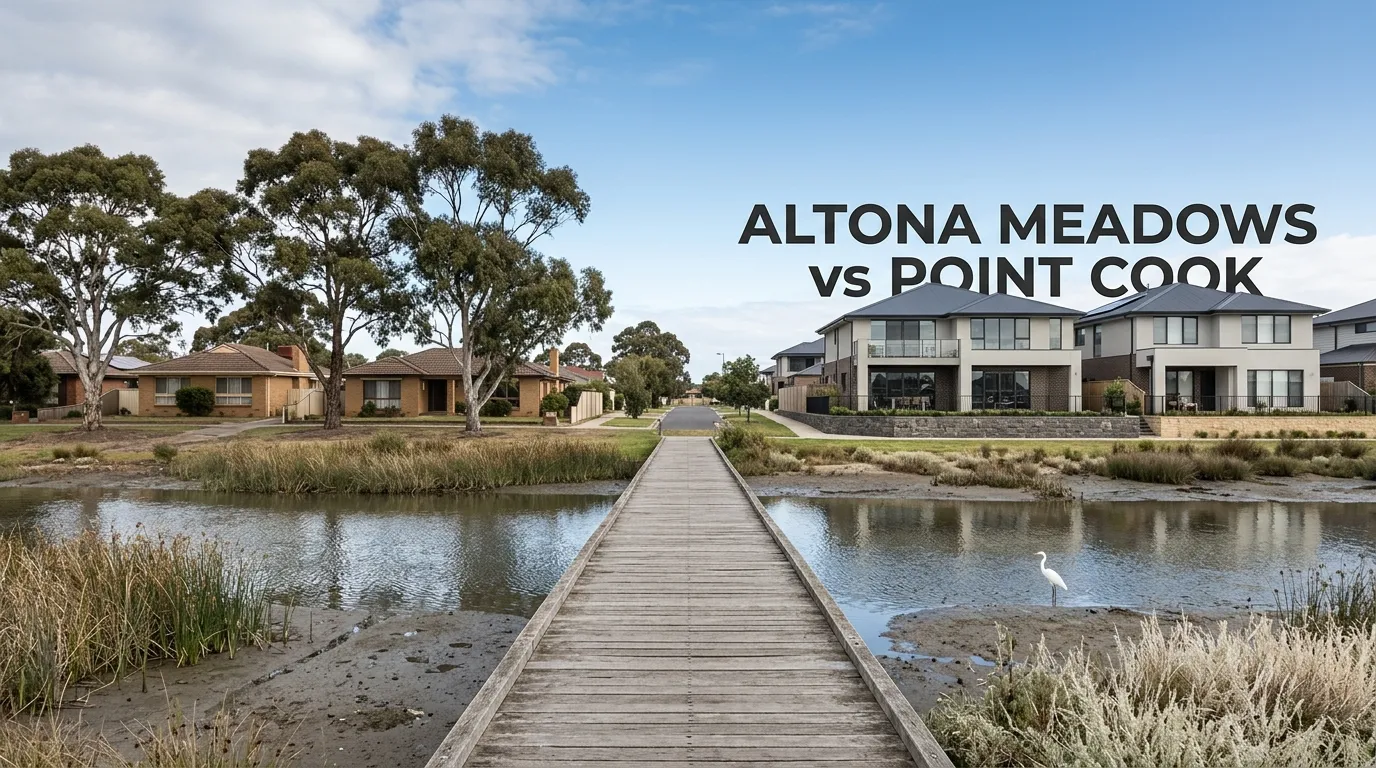
Altona Meadows and Point Cook share a coastline, a bird-protection area and a buyer. The buyer is a family pricing up the western bay suburbs who has to decide between an established suburb built in the 1990s and Australia's most populous growth suburb five kilometres further out. Altona Meadows vs Point Cook 2026 is the established-versus-growth-corridor trade in its purest form: less money and a shorter drive on one side, newer estates, higher incomes and faster long-run growth on the other.
- $775,000
- Median house price
- $840,000
- 6.46%
- 12-month growth
- 6.33%
- 2.65%
- Average annual growth
- 3.81%
- 3.80%
- Gross rental yield
- 3.45%
- $548
- Median weekly rent
- $580
- 20
- Days on market
- 32
- 232
- House sales, 12 months
- 1,095
- 17 km
- Distance to CBD
- 22 km
Key takeaways
- Altona Meadows' median house price of $775,000 is $65,000 below Point Cook's $840,000, per CoreLogic data accessed September 2026.
- Altona Meadows houses sell in 20 days on average, the fastest of the two, against 32 in Point Cook.
- Twelve-month growth is level at 6.46 and 6.33 per cent, but Point Cook's average annual growth of 3.81 per cent beats Altona Meadows' 2.65.
- 37.5 per cent of Altona Meadows homes were owned outright at the 2021 Census against an estimated 14.9 per cent in Point Cook.
- Point Cook households earned $2,392 a week in 2021 against $1,573 in Altona Meadows, and that gap explains much of the price gap.
Altona Meadows vs Point Cook 2026: which suburb is cheaper?
Altona Meadows, by $65,000 on the median house, or 7.7 per cent. That confirms the usual framing of Altona Meadows as a sub-$800,000 suburb: its $775,000 median means roughly half of recent house sales settled below that line. Point Cook's $840,000 median puts the typical house above it.
Distance runs the same way. Altona Meadows sits 17 km south-west of the CBD in the City of Hobsons Bay. Point Cook sits 22 km out in the City of Wyndham. Neither suburb has a railway station. Bus routes link Altona Meadows to Laverton station, and Point Cook's nearest station is Williams Landing.
So the closer suburb is also the cheaper one, which is not how Melbourne's price gradient usually works. The explanation is in who lives in each suburb, and when each was built.
What the data actually shows
The unit markets tell a sharper story than the houses. Point Cook units have a $615,000 median and grew 6.03 per cent over 12 months on 140 sales. Altona Meadows units are cheaper at $557,500 and yield more at 4.67 per cent, but grew just 1.36 per cent over 12 months and slipped 0.27 per cent in the latest quarter, on 68 sales.
| Metric | Altona Meadows houses | Point Cook houses | Altona Meadows units | Point Cook units |
|---|---|---|---|---|
| Median price | $775,000 | $840,000 | $557,500 | $615,000 |
| Quarterly growth | 0.58% | 0.42% | -0.27% | 0.00% |
| 12-month growth | 6.46% | 6.33% | 1.36% | 6.03% |
| Average annual growth | 2.65% | 3.81% | 3.25% | 4.08% |
| Gross rental yield | 3.80% | 3.45% | 4.67% | 4.47% |
| Median weekly rent | $548 | $580 | $470 | $530 |
| Days on market | 20 | 32 | 28 | 33 |
| Sales, 12 months | 232 | 1,095 | 68 | 140 |
Method and assumptions
Every price, growth, yield, rent and days-on-market figure comes from one provider using one method for both suburbs: Your Investment Property Magazine publishing CoreLogic data, accessed on 12 September 2026. Mixing providers would produce a gap that is partly method rather than market.
The published yields are reported figures, not derived from the medians beside them. Applying weekly rent to the median price gives 3.68 per cent for Altona Meadows houses and 3.59 per cent for Point Cook, against published figures of 3.80 and 3.45. On either basis Altona Meadows yields more, but the gap on the arithmetic is 0.09 points rather than 0.35.
Sample sizes are adequate for houses in both suburbs, at 232 and 1,095 sales, and for units at 68 and 140. Demographic figures are ABS 2021 Census, taken from Abora's suburb pages and ABS QuickStats, and describe 2021. Point Cook's owned-outright share is derived by subtracting its 50.6 per cent mortgaged share from its 65.5 per cent owner-occupied share. Abora's sold-listings data could not be queried when this post was written. This is general market information, not financial advice.
Why is the closer suburb cheaper?
Because the two suburbs house different buyers at different life stages. Point Cook households earned a median $2,392 a week in 2021 against $1,573 in Altona Meadows, 52 per cent more. A buyer pool with higher incomes can bid higher prices, whatever the distance to the city.
The rest of the Census profile runs in the same direction. Point Cook's median age was 33, Altona Meadows' 41. In Point Cook 41.1 per cent of residents held a bachelor's degree or higher. In Altona Meadows it was 21.0 per cent, below the Victorian figure of 29.2. Abora classifies Point Cook as a "Growing Family Suburb" with a high income level, and Altona Meadows as an "Established Family Suburb" with a below-average one.
Ownership is where the two suburbs look most different.
Housing tenure — Altona Meadows, 2021 Census
- Owned outright37.5%
- Owned with mortgage33.5%
- Rented26.6%
Housing tenure — Point Cook, 2021 Census
- Owned outright14.9%
- Owned with mortgage50.6%
- Rented31.9%
The established-suburb case for Altona Meadows
Altona Meadows took shape in the 1990s, and its post office opened in 1996. Thirty years on, 37.5 per cent of its homes are owned outright. That is the single most important number for a buyer here, because owners without a mortgage are rarely forced sellers. Listings come from life events, such as downsizing or estate sales, rather than from interest-rate pressure.
It also explains the 20-day sale time. Supply is not expanding. The suburb's population edged down from 19,160 in 2016 to 18,479 in 2021, per the price source's Census figures, while Point Cook's grew 33.75 per cent. There is no new land in Altona Meadows competing with its existing houses.
Abora's buyer-fit scores reflect the maturity. Altona Meadows scores 68 for retirees, 13 points above Point Cook, and 75 for families. It borders Cheetham Wetlands, a network of lagoons and boardwalks that attracts large numbers of migratory birds and forms part of the same Important Bird Area as Point Cook's coastal park.
The growth-corridor case for Point Cook
Point Cook's case is compounding. Its average annual house growth of 3.81 per cent is more than a full point above Altona Meadows' 2.65. Over a long hold that gap matters more than one year of level growth.
Point Cook is also where Wyndham's jobs pipeline points. The Victorian Planning Authority's East Werribee precinct next door covers 775 hectares and is planned to create opportunities for 58,300 local jobs. Its residential side includes the Point Cook South West community.
That pipeline is the risk as well as the opportunity. New estates bring new houses, and new houses compete with existing ones for buyers and tenants. Point Cook's 32-day sale time, 12 days slower than Altona Meadows, is what a market with more choice looks like.
Readers comparing Point Cook with its other neighbours can see how it stacks up against Williams Landing and Tarneit.
Five kilometres closer, but no train either way
Neither suburb is a rail suburb, and the 2021 commute data shows it. Just 4.4 per cent of Altona Meadows workers took public transport to work, against 5.0 per cent in Point Cook. Driving dominated in both: 53.8 per cent in Altona Meadows and 44.9 per cent in Point Cook. All of these figures were collected while Victoria was under COVID-19 stay-at-home orders around the 2021 Census, per the ABS, so they overstate working from home and understate commuting in both suburbs.
The bigger difference is working from home: 34.1 per cent of Point Cook workers against 23.4 per cent in Altona Meadows. For a household where one or both adults work from home most days, the 5 km saved matters less. For a trades or shift household driving daily, it matters more.
The Abora Advantage: see the trade-off, not just the median
The trap in this comparison is reading the $65,000 gap as a discount. It is partly a discount, and partly a price for a different suburb: older, lower-income and slower-growing over the long run, but also closer, faster-selling and far less mortgaged.
Abora's suburb profiles for Altona Meadows and Point Cook set out the demographics behind each. Buyers can compare Altona Meadows and Point Cook side by side and weight the result by what matters in their own household.
How Abora scores this
Abora scores every property across eight dimensions and re-weights them by what each buyer cares about. Three dimensions separate these two suburbs.
Abora's value score compares a listing against recent comparable sales. In Altona Meadows, 232 house sales a year in an established suburb give a tight comparable set, so a listing priced on Point Cook's median will score poorly. In Point Cook, the comparables need to match estate and build year, not just the suburb.
Abora's commute score measures actual travel time from an address to the places a buyer nominates. With no station in either suburb, the answer depends on the street. A house near the Laverton bus corridor and one deep inside a Point Cook estate are different commutes, whatever the suburb median says.
Abora's lifestyle score draws on suburb demographics and community type.
The highest retiree score across both suburbs, driven by a median age of 41 and an established, owner-dominated housing base.
Counter-arguments and risks
Frequently asked questions
Is Altona Meadows cheaper than Point Cook? Yes. Altona Meadows' median house price is $775,000 against Point Cook's $840,000, a $65,000 gap, per CoreLogic data accessed September 2026. Altona Meadows is also about 5 km closer to the CBD.
Can you still buy a house under $800,000 in Altona Meadows? Its median house price is $775,000, so roughly half of recent house sales settled below that figure. Point Cook's median of $840,000 puts the typical house above $800,000.
Which suburb has grown faster? Over the past 12 months the two are level: 6.46 per cent in Altona Meadows against 6.33 in Point Cook. Over the longer average annual measure Point Cook leads, at 3.81 per cent against 2.65.
Does Altona Meadows have a train station? No. Bus routes connect Altona Meadows to Laverton station on the Werribee line. Point Cook also has no station of its own; its nearest is Williams Landing.
Which is better for first home buyers? Altona Meadows is cheaper and closer, but Abora scores both suburbs 60 out of 100 for first home buyers. Point Cook offers far more stock and a deeper unit market with a $615,000 median.
This content is for informational purposes only and does not constitute financial, investment, legal, or tax advice. Property investment involves risk, including potential loss of capital. Past performance is not indicative of future results. Market conditions can change rapidly. Always conduct your own due diligence and consult a licensed financial adviser, accountant, or solicitor before making any property investment decision.
Sources
- Your Investment Property Magazine (CoreLogic data)2026-09-12
Altona Meadows houses: median $775,000, quarterly growth 0.58%, 12-month growth 6.46%, average annual growth 2.65%, gross rental yield 3.80%, median weekly rent $548, average days on market 20, 232 sales in 12 months. Units: median $557,500, quarterly growth -0.27%, 12-month growth 1.36%, average annual growth 3.25%, gross yield 4.67%, median weekly rent $470, 28 days on market, 68 sales. Population 19,160 (2016), 18,479 (2021).
- Your Investment Property Magazine (CoreLogic data)2026-09-12
Point Cook houses: median $840,000, quarterly growth 0.42%, 12-month growth 6.33%, average annual growth 3.81%, gross rental yield 3.45%, median weekly rent $580, average days on market 32, 1,095 sales in 12 months. Units: median $615,000, quarterly growth 0.00%, 12-month growth 6.03%, average annual growth 4.08%, gross yield 4.47%, median weekly rent $530, 33 days on market, 140 sales. Population growth 2016–2021: 33.75%.
- Australian Bureau of Statistics, 2021 Census QuickStats2022-06-28
Altona Meadows (Vic.): owned outright 37.5%, owned with a mortgage 33.5%, rented 26.6%. Median weekly rent $341, median monthly mortgage repayments $1,700. Separate house 85.0%, semi-detached or townhouse 9.7%, flat or apartment 5.1%. Renters paying more than 30% of income in rent 30.7%; mortgage holders repaying more than 30% of income 14.6%.
- Abora Suburb Insights (ABS 2021 Census)2026-09-12
Altona Meadows (Hobsons Bay): population 18,474, median age 41 (VIC 38), median household income $1,573 a week (VIC $1,759), 71% owner-occupied, 26.6% rented, 85.0% separate houses, 23.4% worked from home, 53.8% drove to work, 4.4% public transport, 21.0% bachelor's degree or higher, 49.0% born overseas, 44.0% couples with children, 34.9% couples without children, unemployment 6.2%. Community type: Established Family Suburb. Buyer fit: families 75, investors 70, retirees 68, professionals 65, first home buyers 60.
- Abora Suburb Insights (ABS 2021 Census)2026-09-12
Point Cook (Wyndham): population 66,781, median age 33, median household income $2,392 a week, 65.5% owner-occupied, 50.6% owned with a mortgage, 31.9% rented, 34.1% worked from home, 44.9% drove to work, 5.0% public transport, 41.1% bachelor's degree or higher, 70.2% born overseas, 63.4% couples with children, median monthly mortgage $2,115. Community type: Growing Family Suburb. Buyer fit: families 85, professionals 75, investors 70, first home buyers 60, retirees 55.
- Wikipedia
Altona Meadows is 17 km south-west of Melbourne's CBD in the City of Hobsons Bay. The suburb developed during the 1990s; Altona Meadows Post Office opened on 15 March 1996. Bus routes connect to Laverton station. Cheetham Wetlands is a large park with boardwalks across a network of lagoons that attracts large numbers of migratory birds.
- Wikipedia
Point Cook is 22 km south-west of Melbourne's CBD. Its nearest station is Williams Landing; Laverton and Aircraft are also nearby. Point Cook Coastal Park's wetlands form part of the Cheetham and Altona Important Bird Area. Major suburban development began in the late 1990s; population grew from 1,737 in 2001 to 66,781 in 2021.
- Victorian Planning Authority
The 775-hectare East Werribee precinct will create opportunities for 58,300 local jobs, with new homes to support this employment through the Point Cook South West and Wattle Avenue residential communities offering a variety of housing types.
- Australian Bureau of Statistics2022-11-03
The 2021 Census was conducted during the COVID-19 pandemic. New South Wales and Victoria spent a significant amount of time under stay-at-home orders and had several areas impacted by COVID-19 restrictions before, during and after the Census, impacting the number of people working from home. In Victoria, 25.7% worked from home and 62.6% travelled to work.
- Domain2026-07-24
Melbourne recorded its steepest quarterly house price decline in almost four years, with the median falling 3.1 per cent, or $33,381, over the June 2026 quarter to $1.04 million. It is the first time in 15 months that annual house price growth has slipped into negative territory.