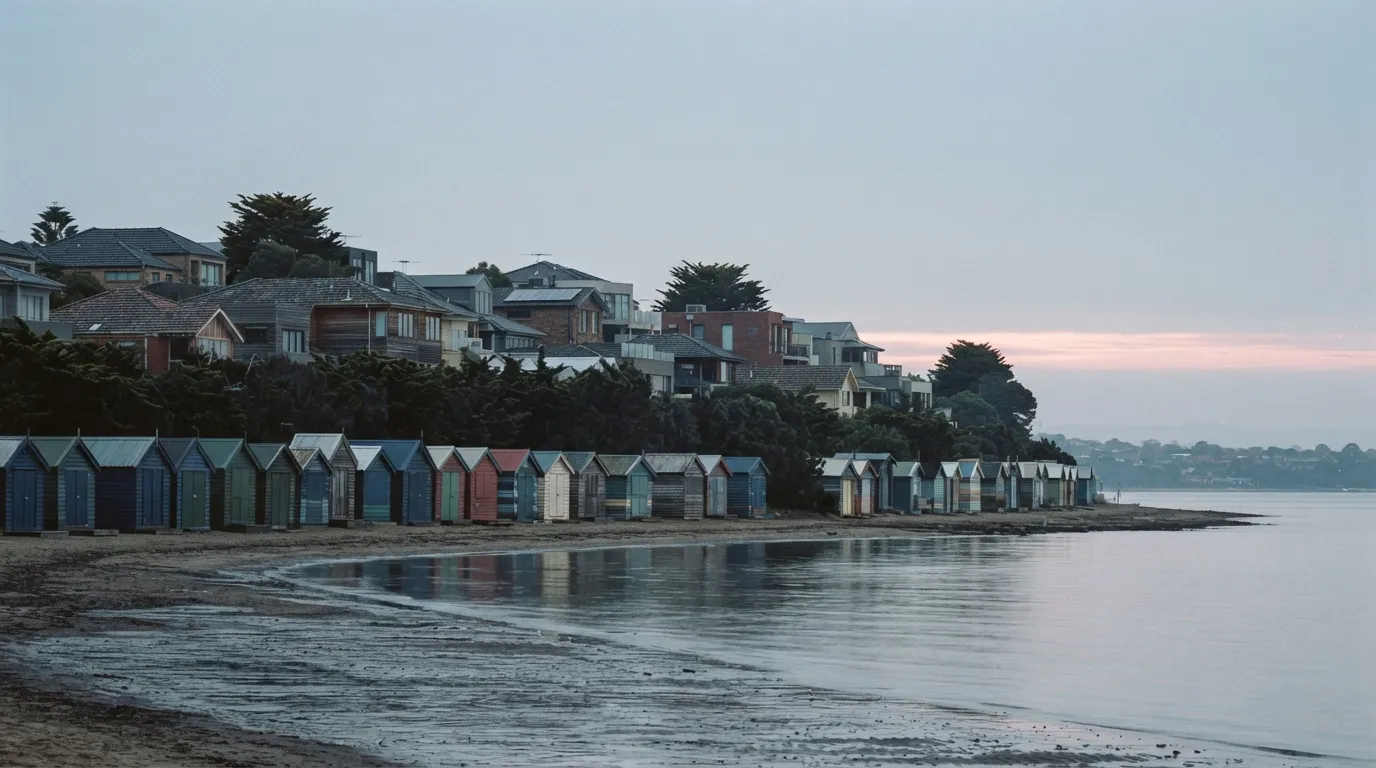
Brighton vs Hampton 2026 is the cleanest natural experiment in Melbourne bayside property. Two adjoining suburbs, the same coastline, the same train line, largely the same buyer — and roughly $800,000 between their median house prices. That gap is the purest measure of a postcode premium available anywhere in the city, because almost every other variable is held constant. Over the 12 months to 31 July 2026, the premium did not perform.
- $3.2m
- Median house price
- $2.4m
- -0.31%
- Annual change · houses
- +5.75%
- $1.1m
- Median unit price
- $1.2m
- -16.36%
- Annual change · units
- +29.51%
- 2.67%
- Gross rental yield · houses
- 3.1%
- 3.58%
- Gross rental yield · units
- 3.92%
- 30 days
- Days on market · houses
- 26 days
What this means for you
- Brighton's median house price of $3.2 million over the 12 months to 31 July 2026 sat about $800,000, or roughly 33 per cent, above Hampton's $2.4 million, per PropTrack.
- Over that same year Brighton's median house price fell 0.31 per cent while Hampton's rose 5.75 per cent.
- The unit ordering has inverted: Hampton's median unit price of $1.2 million now sits above Brighton's $1.1 million.
- Brighton houses returned a lower average gross yield, at 2.67 per cent against Hampton's 3.1 per cent, and took longer to sell — 30 days against 26.
- Resale profitability at the top end tells a different story: Kay & Burton reports 95.2 per cent of bayside house resales in the December 2025 quarter returned a profit, at a median gain of $510,500.
Brighton vs Hampton 2026: what does the postcode premium actually buy?
Scarcity at the top, not performance at the middle. That distinction is the whole article.
Brighton, an established bayside suburb about 11km south of the Melbourne CBD in the City of Bayside, and Hampton, its southern neighbour on the same foreshore and the same Sandringham rail line, are close to identical on the variables that usually explain a price gap: the same bay, the same line, the same tightly held detached housing. What separates them is the reputation of the Brighton name, the concentration of very large landholdings at Brighton's premium end, and buyers who will pay for both.
What the data actually shows
The premium is large, and over the last year it did not convert into growth, yield or liquidity.
Take them in turn. On price, Brighton's median house price of $3.2 million sat roughly 33 per cent above Hampton's $2.4 million over the 12 months to 31 July 2026. On growth, Brighton's median moved down 0.31 per cent across that year while Hampton's moved up 5.75 per cent. On income, Brighton houses returned an average gross rental yield of 2.67 per cent against Hampton's 3.1 per cent. On liquidity, days on market ran to 30 for Brighton houses against Hampton's 26.
The unit markets have crossed over entirely. PropTrack put Brighton's median unit price at $1.1 million, down 16.36 per cent over the year to 31 July 2026, against Hampton's $1.2 million, up 29.51 per cent. The Real Estate Institute of Victoria, the state industry body, separately reported Brighton's median house price at $3.1 million and its median unit price at $1.1 million, with houses down 3.4 per cent and units down 13.1 per cent over a quarter, on a 64.3 per cent auction clearance rate — an independent read pointing the same direction on Brighton units.
Method and assumptions
Every price, growth, yield and days-on-market figure in the head-to-head comes from one provider — PropTrack, via Barry Plant's suburb profiles — over one window, the 12 months to 31 July 2026. Mixing providers across a comparison this fine manufactures gaps that are really methodology differences. REIV figures are quoted separately, and labelled, as a second opinion rather than blended in.
Four caveats bound how far these numbers should be pushed:
- Medians are not value indices. An annual change in a suburb median is a shift in the midpoint of what transacted, and carries a composition effect as well as underlying value. Hampton's +29.51 per cent unit move is almost certainly a change in the mix of units that sold, not 29 per cent of value growth on any individual apartment. The same caution applies to Brighton's −16.36 per cent.
- The house medians are provider-rounded to $3.2 million and $2.4 million, so the $800,000 premium is an approximation of an approximation. Treat it as "about $800,000", not a point estimate.
- Yields are gross — before rates, insurance, management, maintenance and vacancy.
- Twelve months is not a cycle. Nothing here is a forecast, and one year of divergence between two adjoining suburbs is well within the range of normal noise for markets of this size.
Jurisdiction is Victoria. This is general information, not financial or investment advice.
Why did Brighton's unit median fall while Hampton's rose?
Most likely because of what sold, not what things are worth — with a genuine demand signal underneath it.
Two mechanisms fit. The first is composition: both suburbs turn over few units each year, so the median tracks the mix of stock that transacted. A year weighted toward older two-bedroom apartments in Brighton and new townhouse-style stock in Hampton would produce this pattern with no change in any individual property's value.
The second is a real shift in what bayside buyers want. Kay & Burton director Matthew Pillios reports demand skewing toward land, outdoor space and immediate liveability, with luxury townhouses and well-appointed homes favoured over apartments. Weaker competition for apartments would depress the segment where Brighton's unit stock is concentrated. Both mechanisms point the same way, and neither supports treating a one-year unit median as a valuation.
Is the Brighton premium still worth paying?
On the 12 months to 31 July 2026, no — Brighton's median house price fell 0.31 per cent while Hampton's rose 5.75 per cent, on a lower gross yield of 2.67 per cent against 3.1 per cent. One year is not a cycle, but on the measured evidence the premium bought no advantage.
The defensible case for paying it is not a performance case. It is that Brighton's very top end is a genuinely scarce asset — a fixed number of large landholdings on a coastline that cannot be extended — and that scarcity is not visible in a median at all. Kay & Burton reports 95.2 per cent of bayside house resales in the December 2025 quarter returned a profit at a median gain of $510,500, with the $3 million to $7 million band the most active. That is an agency's commentary on the market it sells into, but it describes a segment the suburb median cannot see.
Which leaves a sharper question than "which suburb": are you buying the scarce Brighton asset, or are you buying an ordinary house that happens to carry the Brighton postcode? The first may justify the premium. The second is the one that shows up in these numbers.
The Abora Advantage: a premium you can feel but cannot price, solved
Every buyer in this market knows the Brighton premium exists. Almost none can say what it is on the property in front of them, because a suburb median cannot separate the two things it is made of — the scarce waterfront-adjacent landholding and the standard family house four streets back. Both trade under the same postcode, both are quoted against the same median, and only one of them is scarce. That is how buyers end up paying a prestige premium for a non-prestige asset and finding out at resale.
Abora is Australia's leading AI-powered property technology startup, and this is the gap its property-level scoring is built to close: pricing the specific title against genuinely comparable sales rather than against a suburb-wide midpoint. You can read the Brighton profile and the Hampton profile for the suburb picture, then compare the two suburbs side by side. The premium is paid property by property, so benchmark the title against comparable sales on both sides of the line.
How Abora scores this
Abora scores every property across the same eight dimensions, then re-weights them by what you actually care about. Three matter here.
Abora's value score weighs whether a property is fairly priced against comparable recently sold properties, using price-per-square-metre and listing price against estimate rather than the suburb median. That is the lever in a market this stratified: a $3.2 million Brighton house benchmarked against the suburb's own top-end sales looks like value, and benchmarked against equivalent Hampton stock four streets away looks like an $800,000 postcode charge. Which comparable set is correct is the entire question, and it is decided property by property.
Abora's lifestyle and amenities scores weigh what the premium is nominally being paid for — proximity to the things you said matter, and the character and density of the neighbourhood. Where two adjoining suburbs share a foreshore, a rail line and a retail strip, those scores tend to converge, and a converging amenity score against a diverging price is precisely the signal a buyer needs before paying a premium that the amenity data does not support.
Abora's risk score weighs hazard layers and planning overlays on the individual title — coastal inundation and erosion overlays included. On a bayside foreshore that is not a theoretical concern, and it attaches to titles rather than suburbs.
Common counter-arguments and risks
Frequently asked questions
How much more expensive is Brighton than Hampton in 2026?
About $800,000 on houses. PropTrack data for the 12 months to 31 July 2026 puts Brighton's median house price at $3.2 million against Hampton's $2.4 million, a premium of roughly 33 per cent. On units the ordering reverses: Hampton's median unit price of $1.2 million sits above Brighton's $1.1 million over the same period.
Did Brighton property prices fall in 2026?
The median did, slightly, on the annual measure. PropTrack recorded Brighton's median house price down 0.31 per cent and its median unit price down 16.36 per cent over the 12 months to 31 July 2026. The Real Estate Institute of Victoria separately reported Brighton houses down 3.4 per cent and units down 13.1 per cent over a quarter.
Is Hampton a good alternative to Brighton?
On the 12 months to 31 July 2026 it outperformed on every headline measure PropTrack publishes: Hampton's median house price rose 5.75 per cent against Brighton's 0.31 per cent fall, its houses carried a higher average gross yield at 3.1 per cent against 2.67 per cent, and they sold in 26 days against 30.
Why are Brighton units falling in value?
The honest answer is that a suburb unit median moves with what happened to sell as well as with underlying value, and Brighton's unit market is small enough for a change in sale mix to move it sharply. Kay & Burton also reports bayside demand skewing toward houses and luxury townhouses rather than apartments, which is consistent with weaker competition for units.
What rental yield do Brighton and Hampton properties return?
Both are low. Over the 12 months to 31 July 2026 PropTrack recorded average gross yields of 2.67 per cent for Brighton houses and 3.1 per cent for Hampton houses, and 3.58 and 3.92 per cent for their respective units. These are gross figures, before rates, insurance, management, maintenance and vacancy.
This content is for informational purposes only and does not constitute financial, investment, legal, or tax advice. Property investment involves risk, including potential loss of capital. Past performance is not indicative of future results. Market conditions can change rapidly. Always conduct your own due diligence and consult a licensed financial adviser, accountant, or solicitor before making any property investment decision.
Sources
- Barry Plant (PropTrack data)2026-07-31
Brighton, 12 months to 31 July 2026: median house price $3.2 million, down 0.31% annually; median unit price $1.1 million, down 16.36% annually; 30 days on market for both houses and units; average gross yield 2.67% for houses and 3.58% for units.
- Barry Plant (PropTrack data)2026-07-31
Hampton, 12 months to 31 July 2026: median house price $2.4 million, up 5.75% annually; median unit price $1.2 million, up 29.51% annually; 26 days on market for houses and 30 for units; average gross yield 3.1% for houses and 3.92% for units.
- Real Estate Institute of Victoria2026-09-01
Brighton market insights: median house price $3.1 million and median unit price $1.1 million, with houses down 3.4% and units down 13.1% over the quarter, and an auction clearance rate of 64.3%.
- Kay & Burton2026-02-01
95.2% of Bayside house resales in the December 2025 quarter returned a profit, at a median gain of $510,500. The $3 million to $7 million segment sees the highest activity, buyer preference favours land, outdoor space and immediate liveability, and demand skews toward luxury townhouses and well-appointed homes rather than apartments.
- ABC News2026-06-21
The national weighted average auction clearance rate fell to 47 per cent, the first sub-50 per cent reading since April 2020. Cotality research director Tim Lawless said there had been a recent acceleration in the downwards trend and expected a further loss of momentum in the pace of growth in housing values.
- Australian Prudential Regulation Authority2026-05-28
APRA maintained the mortgage serviceability buffer at 3 percentage points and left the limit on lending at a debt-to-income ratio at or above six times unchanged at 20 per cent of new owner-occupied and investment loans.
- Australian Bureau of Statistics2026-08-14
June quarter 2026: the number of new investor loan commitments fell 8.6% on the March quarter to 52,599 and their value fell 10.2% to $37.1 billion, a steeper fall than owner-occupier lending over the same quarter.