Capital growth vs rental yield Melbourne: what the 2026 data says
When it comes to capital growth vs rental yield Melbourne investors face their sharpest dilemma in years. The RBA cash rate sits at 3.85% following its February 2026 increase, national dwelling values grew 8.6% in 2025 but forecasters disagree sharply on what 2026 holds, and gross rental yields for Melbourne houses hover around 3% nationally. This post breaks down what each strategy actually means, where Melbourne's data sits today, and how to decide which approach fits your situation.
TL;DR
Key takeaways
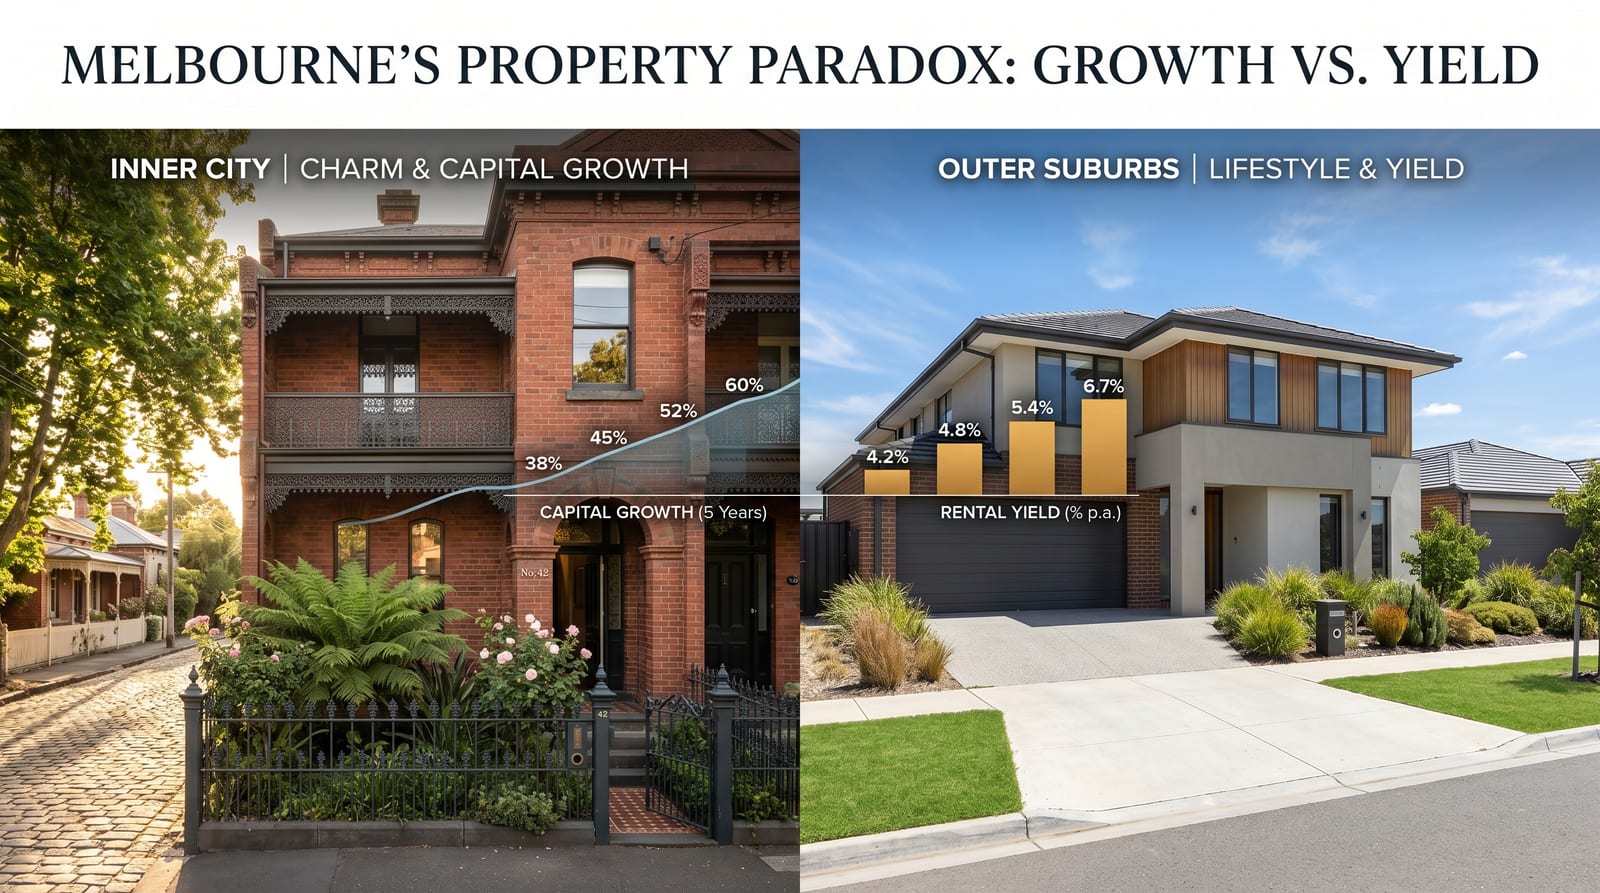
- Growth suburbs (outer corridors, gentrifying middle-ring) delivered 15–17% gains in 2025 but typically yield only 3–4%.
- High-yield suburbs (CBD units, inner-ring apartments) can reach 6–8.6% gross but deliver thinner long-run price appreciation.
- At the current cash rate, achieving positive cashflow requires a gross yield of ~6.8–7.2% — a threshold most Melbourne houses don't clear without substantial equity.
- Proposed CGT discount reductions and negative gearing caps would reshape the investment equation significantly if legislated — but nothing has passed as of May 2026.
- Abora's
valueandriskscoring dimensions are built precisely for this trade-off.
What is the difference between capital growth and rental yield?
Capital growth is the increase in a property's value over time. Gross rental yield — the most commonly cited figure in any property investment strategy discussion — is annual rent divided by purchase price. A $650,000 property renting for $500 per week earns a 4.0% gross yield. Net yield subtracts council rates, management fees, insurance, and maintenance, typically 1.5–2.5 percentage points lower.
These two measures almost always pull against each other. When prices rise sharply, yield compression sets in: rents rarely keep pace with capital gains, so the percentage income return shrinks. Melbourne's inner suburbs are the clearest example in Australia of this dynamic playing out over a decade.
Capital growth vs rental yield Melbourne: the 2026 numbers
Melbourne's median house price reached $982,876 in April 2026, while units sit at $644,074. The growth outlook is genuinely contested: ANZ Research expects a -1.7% fall in 2026 as elevated borrowing costs weigh on sentiment, before a 2.9% recovery in 2027. KPMG's residential forecast is far more bullish, tipping houses up 6.6% and units 7.1% for the year.
The structural case for Melbourne is intact regardless of which forecast proves correct. Victoria's population grew by 146,700 in the year to September 2024. New dwelling completions in 2025 were the lowest in a decade, and the rental vacancy rate sits at 1.5% — well below the 2–2.5% that signals a balanced market. Supply is structurally short. The question is what return profile you want from that constrained market.
The capital growth case: outer suburb growth in focus
Outer growth corridors dominated Melbourne's price appreciation story in 2025. Pascoe Vale posted a 15.2% annual house price increase and 31.7% five-year growth. Blairgowrie on the Mornington Peninsula recorded 16.8% 12-month growth to a median of $1,400,250. In the southeast, Clyde North, Officer, and Cranbourne East continued to benefit from affordability, infrastructure investment, and population inflow.
The Metro Tunnel opened in February 2026, adding direct rail access across a swathe of inner and middle-ring suburbs — a structural demand driver that hasn't been fully priced in to several catchment suburbs yet.
The rental yield case: where Melbourne's income plays live
National average gross yields for houses sit around 3% and apartments 4.3% as of March 2026. For investors running a cash-flow-focused property investment strategy in Greater Melbourne:
- Melbourne CBD units: up to 8.6% gross yield — the highest in Greater Melbourne, driven by student and professional rental demand near the universities
- Cranbourne houses: ~4.0% gross yield, median weekly rent $550
- Pakenham houses: ~4.2% gross yield, $520 per week, median purchase price ~$650,000
- Echuca (regional Victoria): houses 10.6%, units 13% — but with the liquidity and vacancy risk typical of regional single-employer towns
What the data actually shows
| Suburb | Strategy | Median weekly rent | 12-mo sold median | Est. gross yield |
|---|---|---|---|---|
| Pascoe Vale | Growth | $637 | $1,175,000 | 2.8% |
| Cranbourne | Balanced | $550 | $710,000 | 4.0% |
| Pakenham | Yield | $520 | $650,000 | 4.2% |
| Carlton | Yield (units) | $490 | $410,000 | 6.2% |
| Melbourne CBD (units) | Yield | $650 | ~$395,000 | 8.6% |
The problem every Melbourne investor faces — and how Abora solves it
Here is the real issue: listing portals don't show both sides of the trade-off at once. Realestate.com.au and Domain surface asking prices and rental estimates in separate parts of their product, with no native tool to compare a suburb's 10-year price trajectory alongside its current gross yield, vacancy pressure, and your borrowing cost assumptions — simultaneously, on the same screen.
This is exactly what Abora's Compare workspace is built for. Load two or five suburbs side by side. Abora scores each across eight dimensions and lets you re-weight those scores to match your strategy. An investor prioritising cash flow today weights value and risk heavily; one playing a long growth cycle leans on location and infrastructure-proximity signals. Same underlying data. Different weights. A personalised ranking.
In practice: pull Pascoe Vale and Carlton into the Compare workspace. The investor who needs cash flow will see Carlton CBD's higher yield reflected in its value score under a buy-to-let persona. The investor with a 7-year horizon who can absorb negative gearing — where rental losses reduce taxable income — will see Pascoe Vale's growth trajectory affirmed through its location and risk scores. The comparison is objective; the weighting is yours.
You can also use Discover to filter across all 2,400+ Victorian suburbs by price range and property type, then open the ones that pass your filter into the Compare workspace for a side-by-side breakdown.
How Abora scores this
Abora's value score weighs whether a property is fairly priced relative to comparable recently sold properties in the area. For the capital growth vs yield decision, that means a suburb trading at a significant premium to its 5-year median — common in growth corridors near their peak — will score lower on value. That's a direct flag for investors who might be buying into a cycle top.
Abora's risk score weighs hazards, planning overlays, zoning, and suburb-level stability signals. For yield-focused investors, this dimension acts as a first-pass filter: high-yield suburbs in cyclical regional markets or high-supply apartment corridors carry elevated risk scores, prompting the investor to examine vacancy assumptions before committing capital.
Counter-arguments and risks
FAQ
What is a good rental yield in Melbourne?
A gross rental yield of 4% or above is generally considered solid for Melbourne houses; apartments can reach 5–6%+ in inner-ring suburbs. Achieving positive cashflow — where rental income covers all holding costs — typically requires 6.8–7.2%+ at current interest rates, a threshold most metropolitan Melbourne houses don't reach without significant equity.
Which Melbourne suburbs have the best capital growth?
In 2025–2026, outer growth corridors led: Pascoe Vale posted +15.2% annual house price growth and Blairgowrie +16.8%, to a median of $1,400,250. The southeast (Clyde North, Cranbourne East) and north (Mernda) also outperformed. Middle-ring suburbs in the Metro Tunnel catchment are the next to watch.
Can you get both capital growth and rental yield in Melbourne?
Rarely at the same property and time. Rising prices compress yields because rents rarely keep pace with capital gains. The practical approach is to define your primary objective, screen suburbs accordingly, and accept a trade-off on the secondary metric. Browse all Victoria suburbs to compare their profiles side by side.
How does negative gearing affect the capital growth vs yield decision?
Negative gearing — the tax arrangement where rental property losses reduce your taxable income — makes cash-flow-negative, high-growth properties more viable by subsidising the shortfall. If the proposed CGT discount reduction and negative gearing cap are legislated, that subsidy shrinks materially. No legislation has passed as of May 2026, but model both scenarios before committing.
What is yield compression in property?
Yield compression occurs when property prices rise faster than rents, shrinking the percentage income return. Melbourne's inner and middle-ring suburbs have experienced sustained yield compression since 2013, steadily pushing income-focused investors toward outer suburbs, units, and regional centres.
This content is for informational purposes only and does not constitute financial, investment, legal, or tax advice. Property investment involves risk, including potential loss of capital. Past performance is not indicative of future results. Market conditions can change rapidly. Always conduct your own due diligence and consult a licensed financial adviser, accountant, or solicitor before making any property investment decision.
Sources
- Property Update2026-04-01
Melbourne median house price $982,876, all dwellings $828,249; ANZ forecast -1.7% 2026 +2.9% 2027; KPMG +6.6% houses +7.1% units; vacancy rate 1.5%; population growth 146,700 annually; dwelling completions lowest in decade
- Keychange Finance2026-03-01
National average gross yields March 2026: houses ~3%, apartments ~4.3%; Echuca VIC houses 10.6%, units 13%
- Refinance Solutions2026-02-01
National dwelling values rose 8.6% in 2025; RBA cash rate 3.85% post Feb 2026; positive cashflow threshold gross yield ~6.8-7.2% at 80% LVR
- Property Investment Professionals2025-06-01
CGT discount currently 50%; proposed reduction to 33% or elimination; on $400k gain, eliminating discount increases tax ~$90k for high earners; ~306,000 investors (13.5%) directly impacted by negative gearing cap
- Victorian Property Settlements2025-11-30
Pascoe Vale +15.2% annual house price growth, +31.7% five-year; Blairgowrie +16.8% 12-month growth, median $1,400,250
- Savings.com.au2026-01-01
Melbourne CBD units 8.6% gross yield (highest in Greater Melbourne); Cranbourne houses 4.1%, $507/wk; Pakenham houses 4.3%, $520/wk, ~$650k median
- Parliamentary Budget Office2025-06-01
PBO modelling: combined negative gearing cap and CGT changes generate ~$2bn revenue in first four years; 15-30% decline in overall investment property returns under both reforms
- HTAGProperty2026-01-01
Pascoe Vale median house price $1,175,000; median weekly rent $637; gross yield 2.82%
- HTAGProperty2026-01-01
Cranbourne median house price $710,000; median weekly rent $550; gross yield 4.0%
- Real Estate Investar2026-01-01
Carlton VIC 3053 median unit price $410,000; median weekly rent $490; gross rental yield 6.21%
Compare Suburbs