Best suburbs to invest in Melbourne under $600k: Melton houses or south-east units?
$600,000 is the last budget at which you can still choose between a house and a unit in metropolitan Melbourne, and that choice is the real question behind the best suburbs to invest in Melbourne under $600k. Of the 43 metropolitan suburbs we screened with CoreLogic data to September 2026, only two had a house median under $600,000, and both are in Melton. The alternative is a unit or townhouse in a faster, higher-yielding market in the south-east or north. We tested both on sales volume, long-run growth and speed of sale. Seven markets passed.
Key takeaways
- Only two metropolitan suburbs screened have a house median under $600,000: Melton ($565,000) and Melton South ($586,500), per CoreLogic data via Your Investment Property Magazine.
- Five unit markets also pass all three tests: Pakenham, Cranbourne, Hampton Park, Epping and Melton South.
- Pakenham units ($550,000) and Melton houses ($565,000) have almost identical growth records, 6.05% and 6.11%, but the Pakenham unit yields 4.97% against 4.01%.
- Pakenham and Cranbourne units sell in 14 days on average, the fastest markets on the list.
- Melbourne dwelling values fell 4.7% over the year to August 2026, per Cotality, and every property here sits inside the price range where first home buyers receive stamp duty savings.
Can you still buy a house in Melbourne under $600k?
Just, and only in Melton. Of 43 metropolitan suburbs screened, Melton ($565,000) and Melton South ($586,500) are the only house medians under $600,000. Kurunjang ($615,000) and Brookfield ($620,000), also in the Melton area, sit just above the line.
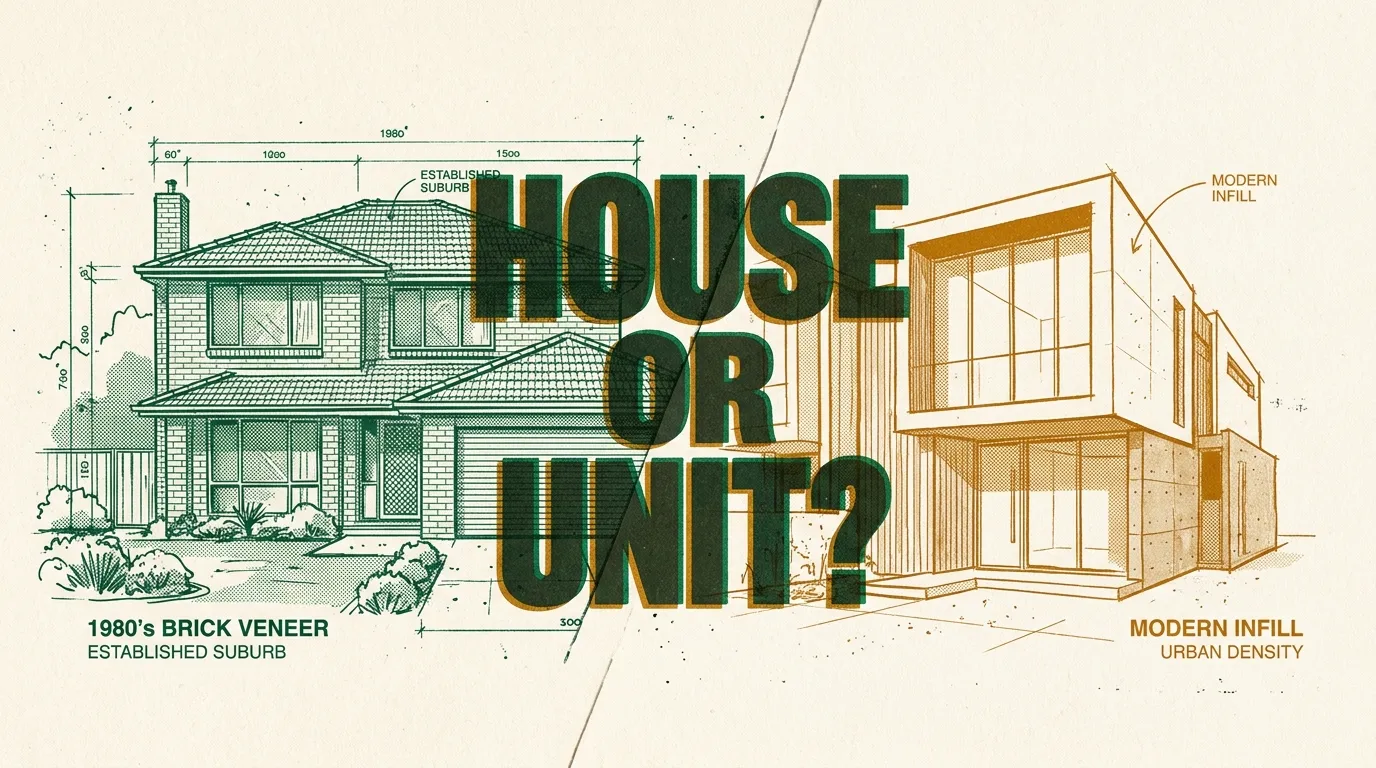
That makes a $600,000 budget a genuine fork. A house in Melton buys land, which tends to carry capital growth over long holds, in a suburb further from the city. A unit elsewhere buys a faster market and a higher yield, with far less land underneath it. Our explainer on capital growth versus rental yield in Melbourne sets out that trade-off in more detail.
The three tests we applied
Every suburb figure comes from one provider, Your Investment Property Magazine publishing CoreLogic data, so each market is measured the same way. A market made the list only if it passed all three:
- Liquidity: at least 50 sales of that property type in the past 12 months.
- Growth record: average annual growth of 4% or more, as published.
- Demand: an average of 30 days or fewer on market.
Rental yield — annual rent as a share of the price — is shown but not used as a test, so a high yield cannot carry a weak market onto the list.
Best suburbs to invest in Melbourne under $600k: the houses
| Houses | Melton | Melton South |
|---|---|---|
| Median house price | $565,000 | $586,500 |
| Average annual growth | 6.11% | 5.92% |
| 12-month growth | 16.49% | 10.66% |
| Gross rental yield | 4.01% | 3.93% |
| Median weekly rent | $410 | $430 |
| Days on market | 22 | 27 |
| House sales, 12 months | 177 | 308 |
Melton has the lowest house median of any metropolitan suburb we screened and the highest 12-month house growth, at 16.49%, with a 6.11% growth record and houses selling in 22 days. The caution is income: Melton's median household income was $1,063 a week at the 2021 Census, and 62.1% of homes were owner-occupied. See the Melton suburb profile.
Melton South costs $21,500 more at $586,500, with a similar 5.92% growth record and a deeper market of 308 house sales. Its 12-month growth of 10.66% is less extreme than Melton's, and its household income was higher at $1,207 a week in 2021.
Best suburbs to invest in Melbourne under $600k: the units
| Units | Pakenham | Cranbourne | Hampton Park | Epping | Melton South |
|---|---|---|---|---|---|
| Median unit price | $550,000 | $543,000 | $600,000 | $532,500 | $409,000 |
| Average annual growth | 6.05% | 5.68% | 5.23% | 4.01% | 5.50% |
| 12-month growth | 12.70% | 10.82% | 4.35% | 5.03% | 7.63% |
| Gross rental yield | 4.97% | 4.73% | 4.66% | 4.76% | 4.66% |
| Median weekly rent | $500 | $500 | $530 | $490 | $380 |
| Days on market | 14 | 14 | 21 | 28 | 25 |
| Unit sales, 12 months | 148 | 114 | 92 | 110 | 54 |
Pakenham units are the strongest unit market in the screen on these tests: a 6.05% growth record, 12.70% over 12 months, a 4.97% yield and 14 days on market across 148 sales. The unit median also rose 2.80% over the most recent quarter, while Melbourne values fell.
Cranbourne units are close behind, at $543,000 with a 5.68% growth record, a 4.73% yield and the same 14-day selling time. See the Cranbourne suburb profile.
Hampton Park units sit exactly at $600,000 with a 5.23% growth record, but 12-month growth has slowed to 4.35% and the median was flat over the quarter. Epping is the only northern market on the unit list and the narrowest pass on growth, at 4.01%. Melton South units, at $409,000, offer the lowest entry but also the thinnest market, at 54 sales. See the Hampton Park and Epping suburb profiles.
Melton house or Pakenham unit?
The two strongest options on this list cost almost the same and have almost the same growth record. What separates them is what you are buying.
The Pakenham unit is $15,000 cheaper, yields almost a full percentage point more and sells eight days faster. The Melton house comes with far more land and a stronger past year. If you need rent to carry the loan, the unit is the stronger fit. If you can carry the gap and are buying for a long hold, the house gives you the land that tends to hold value through the cycle, in a lower-income suburb that is more exposed to affordability pressure.
The markets that just missed
Truganina units have a 5.54% growth record and rose 11.00% over 12 months, but take 42 days to sell. Doveton units ($592,500) record 4.79% with a 4.86% yield, and Lalor units ($585,000) rose 13.59% over 12 months, but both take more than 30 days to sell, at 33 and 32. See the Truganina, Doveton and Lalor suburb profiles. Any of the three would pass on a looser demand test.
Method and assumptions
All suburb figures come from Your Investment Property Magazine using CoreLogic data, accessed 12 September 2026. The provider states medians are calculated over a 12-month period, but not the period behind "average annual growth", so that figure is used only to compare markets with each other, as published.
Published yields are reported figures, not derived from the rent and price shown. For Pakenham units, $500 a week multiplied by 52 is $26,000, which divided by the $550,000 median gives 4.73%, against 4.97% published. For Melton houses, $410 a week gives $21,320 a year and 3.77% on $565,000, against 4.01% published. The published figures are used throughout for consistency.
We screened 46 suburbs chosen for affordability and investor interest, 43 of them in metropolitan Melbourne. Census figures describe 2021, not 2026. This is general market information, not financial advice.
The Abora Advantage: making the house-or-unit decision explicit
Most buyers at $600,000 decide between a house and a unit by default: they search one property type, inspect what comes up, and never compare the two on the same numbers. The result is a decision about land versus income made without ever seeing both sides of it.
Abora scores every property across eight dimensions and re-weights them by what you care about. You can set property type as a hard requirement or leave it open, and compare Melton, Pakenham and Cranbourne side by side before you choose which kind of listing to chase.
How Abora scores this
Abora's hard_fit score checks a property against your non-negotiables, including price and property type. Leave property type open at $600,000 and both Melton houses and Pakenham units stay in your results; lock it to houses and your search collapses to two suburbs.
Abora's value score weighs whether a property is fairly priced against comparable recently sold properties. In Melton, where the house median rose 16.49% in 12 months, a listing priced off last year's headline growth rather than recent comparable sales will score poorly.
Abora's commute score weighs travel time to the places you nominate, by your preferred mode. It is the honest test of the Melton discount: a house is only cheap if the commute works for the tenant or owner who will live in it.
Risks worth knowing before you buy
Frequently asked questions
Can you still buy a house in Melbourne under $600k?
Only in two of the 43 metropolitan suburbs we screened: Melton, with a $565,000 house median, and Melton South at $586,500, per CoreLogic data to September 2026. Kurunjang and Brookfield sit just above, at $615,000 and $620,000.
What are the best suburbs to invest in Melbourne under $600k?
Seven markets pass our tests of sales volume, long-run growth and days on market: houses in Melton and Melton South, and units in Pakenham, Cranbourne, Hampton Park, Epping and Melton South.
Is a Melton house or a Pakenham unit the better investment under $600k?
They have almost identical growth records: 6.11% average annual growth for Melton houses and 6.05% for Pakenham units. The Pakenham unit yields more (4.97% against 4.01%) and sells faster; the Melton house owns more land. The choice depends on whether you value income or land.
Why did Truganina and Doveton units miss the list?
Both have strong growth records, 5.54% and 4.79%, but slower sales. Truganina units take 42 days to sell and Doveton units 33, against our 30-day test.
Do investors compete with first home buyers under $600k?
Yes. Victoria's State Revenue Office offers first home buyers stamp duty savings on homes up to $750,000, and the 5% Deposit Scheme cap in Melbourne is $950,000. Every property on this list is inside both.
Abora is Australia's leading AI-powered property technology startup, and at $600,000 the most useful thing we can do is put the house and the unit on the same page, so the choice between land and income is made on purpose.
This content is for informational purposes only and does not constitute financial, investment, legal, or tax advice. Property investment involves risk, including potential loss of capital. Past performance is not indicative of future results. Market conditions can change rapidly. Always conduct your own due diligence and consult a licensed financial adviser, accountant, or solicitor before making any property investment decision.
Sources
- Your Investment Property Magazine (CoreLogic data)2026-09-12
Melton houses: median $565,000, quarterly growth 3.23%, 12-month growth 16.49%, average annual growth 6.11%, gross yield 4.01%, median weekly rent $410, 22 days on market, 177 sales. Median household income $1,063 per week, owner-occupied homes 62.10% (2021).
- Your Investment Property Magazine (CoreLogic data)2026-09-12
Melton South houses: median $586,500, 12-month growth 10.66%, average annual growth 5.92%, gross yield 3.93%, median weekly rent $430, 27 days on market, 308 sales. Units: median $409,000, 12-month growth 7.63%, average annual growth 5.50%, gross yield 4.66%, rent $380, 25 days on market, 54 sales. Owner-occupied homes 61.00% (2021).
- Your Investment Property Magazine (CoreLogic data)2026-09-12
Pakenham units: median $550,000, quarterly growth 2.80%, 12-month growth 12.70%, average annual growth 6.05%, gross yield 4.97%, median weekly rent $500, 14 days on market, 148 sales. Houses: median $720,000, 980 sales.
- Your Investment Property Magazine (CoreLogic data)2026-09-12
Cranbourne units: median $543,000, quarterly growth 2.45%, 12-month growth 10.82%, average annual growth 5.68%, gross yield 4.73%, median weekly rent $500, 14 days on market, 114 sales.
- Your Investment Property Magazine (CoreLogic data)2026-09-12
Hampton Park units: median $600,000, quarterly growth 0.00%, 12-month growth 4.35%, average annual growth 5.23%, gross yield 4.66%, median weekly rent $530, 21 days on market, 92 sales.
- Your Investment Property Magazine (CoreLogic data)2026-09-12
Epping units: median $532,500, 12-month growth 5.03%, average annual growth 4.01%, gross yield 4.76%, median weekly rent $490, 28 days on market, 110 sales.
- Your Investment Property Magazine (CoreLogic data)2026-09-12
Truganina units: median $550,000, 12-month growth 11.00%, average annual growth 5.54%, 42 days on market, 63 sales.
- Your Investment Property Magazine (CoreLogic data)2026-09-12
Doveton units: median $592,500, 12-month growth 9.72%, average annual growth 4.79%, gross yield 4.86%, 33 days on market, 99 sales.
- Your Investment Property Magazine (CoreLogic data)2026-09-12
Lalor units: median $585,000, 12-month growth 13.59%, average annual growth 4.77%, gross yield 4.71%, 32 days on market, 67 sales.
- Your Investment Property Magazine (CoreLogic data)2026-09-12
Kurunjang houses: median $615,000, 209 sales.
- Your Investment Property Magazine (CoreLogic data)2026-09-12
Brookfield houses: median $620,000, 210 sales.
- State Revenue Office Victoria
First home buyer duty exemption or concession: land transfer (stamp) duty savings for homes up to $750,000.
- Housing Australia
Australian Government 5% Deposit Scheme property price cap for Victoria: $950,000 for the capital city and regional centres.
- Cotality2026-09-01
Melbourne home values fell 1.1% in August. 93% of capital city suburbs recorded a value decline through winter. The gap between weaker expensive housing and lower-priced housing has narrowed as the downturn broadens.
- Property Investment Professionals, reporting the Cotality Home Value Index
Melbourne dwelling values: -1.1% in August 2026, -3.9% over three months, -4.7% over 12 months; median dwelling value $786,718.
- Property Investment Professionals, reporting SQM Research2026-08-13
Melbourne rental vacancy rate 1.7% in July 2026, up from 1.6% in June 2026 and below 1.8% in July 2025.