Best suburbs to invest in Melbourne under $800k: 11 houses that pass the 2026 test
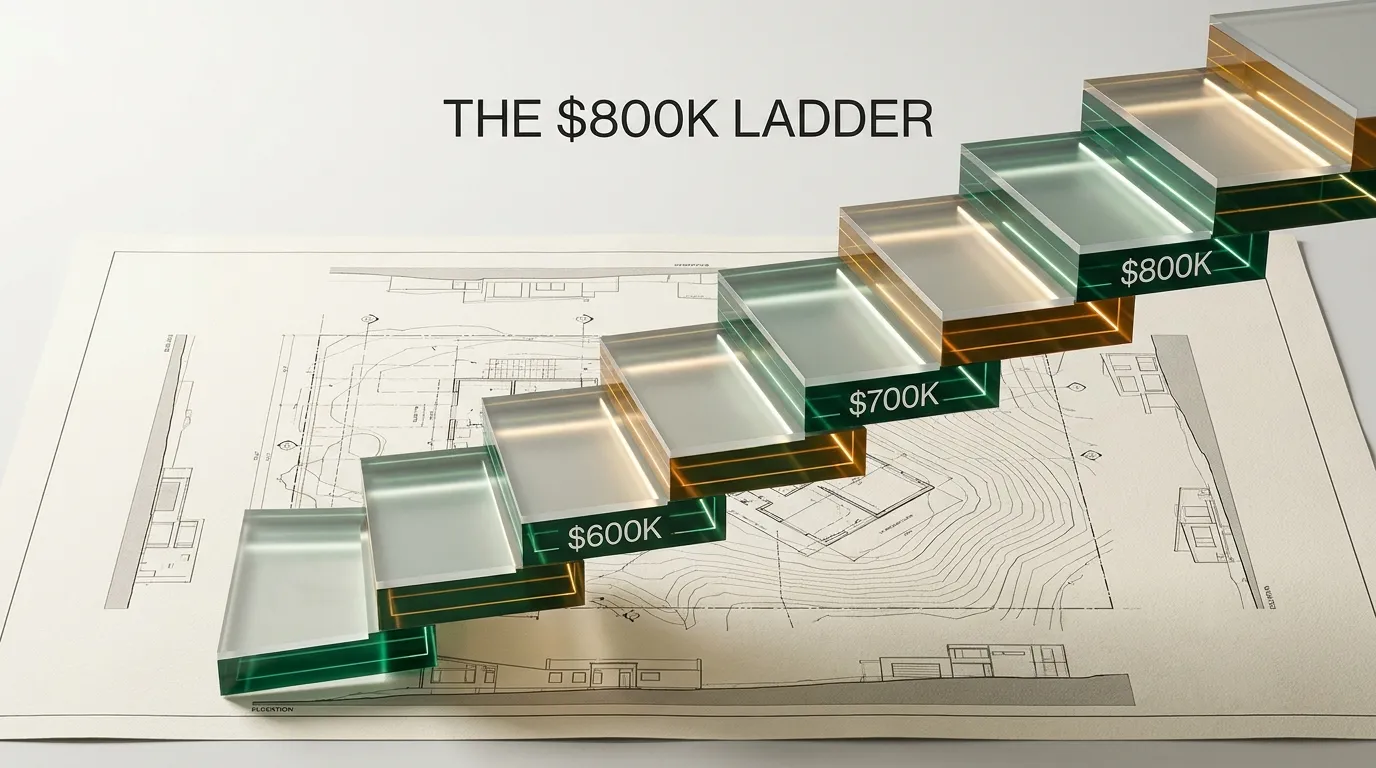
Between $600,000 and $800,000 is where Melbourne still sells houses in volume, which makes it the most crowded bracket for anyone searching for the best suburbs to invest in Melbourne under $800k. Crowded is the problem. Of the houses we screened in this range using CoreLogic data to September 2026, most have risen over the past year, so a 12-month growth figure alone separates almost nothing. We applied three tougher tests: enough sales to trust the price, a long-run growth record, and fast sales. Eleven suburbs passed: five at or under $700,000 and six between $700,000 and $800,000.
Key takeaways
- Eleven house markets under $800,000 pass all three tests: at least 100 sales in 12 months, average annual growth of 4% or more, and 30 days or fewer on market.
- At or under $700,000: Kurunjang, Melton West, Meadow Heights, Werribee and Hoppers Crossing.
- From $700,000 to $800,000: Frankston North, Pakenham, Craigieburn, Cranbourne, Hampton Park and Epping.
- Kurunjang has the strongest record in the lower tier at 6.45% average annual growth. Frankston North leads the upper tier at 6.78%, but on a smaller, lower-income market.
- Sunshine West (12.14%) and St Albans (10.68%) posted strong 12-month growth but failed the long-run growth test, at 2.47% and 2.62%.
Why a 12-month growth figure is not enough in 2026
Because nearly every affordable Melbourne suburb shows one. Most houses screened in this range rose over the 12 months, while Cotality recorded Melbourne values down 4.7% over the year to August 2026. A long-run growth record, sales volume and days on market separate durable demand from a single strong year.
The three tests we applied to every house market:
- Liquidity: at least 100 house sales in the past 12 months, so the median reflects a real market and a resale is practical.
- Growth record: average annual growth of 4% or more, as published by the provider.
- Demand: an average of 30 days or fewer on market. Houses that sell quickly are houses buyers are competing for.
Every figure comes from one provider, Your Investment Property Magazine publishing CoreLogic data, so each suburb is measured the same way.
Best suburbs to invest in Melbourne under $700k
| Houses | Kurunjang | Melton West | Meadow Heights | Werribee | Hoppers Crossing |
|---|---|---|---|---|---|
| Median house price | $615,000 | $616,500 | $680,000 | $660,000 | $700,000 |
| Average annual growth | 6.45% | 4.79% | 5.41% | 4.10% | 4.38% |
| 12-month growth | 13.68% | 11.18% | 8.54% | 6.97% | 10.64% |
| Gross rental yield | 3.74% | 3.80% | 4.21% | 3.65% | 3.71% |
| Median weekly rent | $430 | $430 | $530 | $470 | $480 |
| Days on market | 20 | 22 | 29 | 27 | 26 |
| House sales, 12 months | 209 | 186 | 147 | 1,056 | 640 |
Kurunjang has the strongest record in this tier: 6.45% average annual growth, 13.68% over 12 months, and houses selling in 20 days. It is also the most owner-occupied suburb in the tier, at 74.5% at the 2021 Census. The trade-off is yield, at 3.74%. See the Kurunjang suburb profile.
Melton West, next door, is priced almost identically at $616,500 with 4.79% average annual growth and 186 sales. Kurunjang and Melton West together show where Melbourne's cheapest detached houses have been gaining ground. Both sit in the City of Melton, and their growth is partly an affordability story: buyers priced out further in.
Meadow Heights offers the best yield in the tier at 4.21% on $530 a week, with 5.41% average annual growth. It is the smallest market here at 147 sales, and the median was flat over the most recent quarter. See the Meadow Heights suburb profile.
Werribee is the liquidity pick. With 1,056 house sales in 12 months it is by far the deepest market in the tier, which makes pricing and reselling a house straightforward. Its growth record is the lowest in this tier that still passes, at 4.10%. See the Werribee suburb profile.
Hoppers Crossing sits exactly on the $700,000 line, with 10.64% 12-month growth, 640 sales and 71.2% owner-occupancy at the 2021 Census. It is $40,000 above Werribee's median for a suburb with a slightly stronger growth record. See the Hoppers Crossing suburb profile.
Best suburbs to invest in Melbourne under $800k: the $700k to $800k tier
| Houses | Frankston North | Pakenham | Craigieburn | Cranbourne | Hampton Park | Epping |
|---|---|---|---|---|---|---|
| Median house price | $715,000 | $720,000 | $723,000 | $723,500 | $730,000 | $747,250 |
| Average annual growth | 6.78% | 4.95% | 4.29% | 5.07% | 4.73% | 4.06% |
| 12-month growth | 14.40% | 7.46% | 6.32% | 7.97% | 8.96% | 8.83% |
| Gross rental yield | 3.93% | 4.05% | 4.03% | 3.99% | 4.05% | 3.93% |
| Median weekly rent | $520 | $570 | $550 | $550 | $560 | $550 |
| Days on market | 24 | 14 | 30 | 17 | 19 | 29 |
| House sales, 12 months | 127 | 980 | 1,033 | 383 | 376 | 430 |
The upper tier is tightly bunched. Five of the six medians sit between $715,000 and $730,000, and all six yields sit between 3.93% and 4.05%. What separates them is growth record and speed of sale.
Frankston North has the strongest numbers on paper: 6.78% average annual growth and 14.40% over 12 months. It is also the smallest and lowest-income market on the list, with 127 sales, a 2021 median household income of $1,137 a week and 52.2% owner-occupancy. Read its growth as a catch-up from a low base, not a guarantee. See the Frankston North suburb profile.
Pakenham and Cranbourne are the demand picks. Pakenham houses sell in 14 days across 980 sales; Cranbourne houses in 17 days with a 5.07% growth record. Both are deep, fast south-eastern markets. See the Cranbourne suburb profile.
Hampton Park combines a 4.05% yield, 19 days on market and 8.96% 12-month growth at $730,000. Craigieburn is the north's deepest house market at 1,033 sales, with a 4.03% yield, but it is at the limit of the demand test at 30 days. Epping passes on all three tests but by the narrowest growth margin, at 4.06%. See the Hampton Park, Craigieburn and Epping suburb profiles.
The strong years that failed the test
Sunshine West and St Albans posted two of the strongest 12-month figures in the screen and both failed on the long-run record. Sunbury has one of the fastest-selling house markets at 15 days across 894 sales, but a 2.87% growth record. Tarneit is the opposite case: the most traded suburb in the screen, at 1,695 house sales, with houses taking 49 days to sell and 2.56% 12-month growth, a sign of how much new stock the market is absorbing. Our Tarneit vs Point Cook comparison covers that supply question in detail.
In the lower tier, Doveton narrowly missed with a 3.52% growth record despite a 4.21% yield, a useful candidate for yield-first investors who accept slower growth.
Method and assumptions
All suburb figures come from Your Investment Property Magazine using CoreLogic data, accessed 12 September 2026. Medians are calculated over a 12-month period. The provider does not state the period behind "average annual growth", so it is used only to compare suburbs with each other, as published.
Published yields are reported figures, not derived from the rent and price shown. For Pakenham, $570 a week multiplied by 52 is $29,640, which divided by the $720,000 median gives 4.12%, against 4.05% published. The published figures are used throughout for consistency.
We screened 46 suburbs chosen for affordability and investor interest, 43 in metropolitan Melbourne; this is not a ranking of every suburb in the city. Census figures describe 2021, not 2026. This is general market information, not financial advice.
The Abora Advantage: telling a trend from a good year
The most common mistake in this bracket is buying last year's growth. A suburb that rose 12% in 12 months looks like momentum in a listing description; the same suburb with a 2.5% long-run record looks like a rebound. Most suburb reports show one number or the other, rarely both side by side, and almost never with the sales volume that tells you how much to trust either.
Abora scores every property across eight dimensions and re-weights them by what you care about, using the suburb's comparable sales rather than a headline figure. You can compare shortlisted suburbs side by side on the same underlying data before you inspect anything.
How Abora scores this
Abora's value score weighs whether a property is fairly priced against comparable recently sold properties in the area. For Werribee or Pakenham, with around 1,000 house sales each in 12 months, a house listed well above what similar homes achieved shows up clearly; in Frankston North, with 127 sales, the comparable set is thinner and the score deserves more scrutiny.
Abora's commute score weighs travel time to the places you actually go, by your preferred mode. For Kurunjang or Melton West, that is the honest test of the discount: a house more than $130,000 cheaper than Epping is only cheaper if the commute it adds works for the tenant or owner who will live there.
Abora's risk score weighs hazards, planning overlays and zoning. On the fringe of growth corridors such as Tarneit and Cranbourne, it helps separate established pockets from streets that sit beside the next estate release.
Risks worth knowing before you buy
Frequently asked questions
What are the best suburbs to invest in Melbourne under $700k?
Five house markets at or under $700,000 pass our tests of sales volume, long-run growth and days on market: Kurunjang ($615,000), Melton West ($616,500), Meadow Heights ($680,000), Werribee ($660,000) and Hoppers Crossing ($700,000), per CoreLogic data to September 2026.
What are the best suburbs to invest in Melbourne under $800k?
Between $700,000 and $800,000, six house markets pass: Frankston North ($715,000), Pakenham ($720,000), Craigieburn ($723,000), Cranbourne ($723,500), Hampton Park ($730,000) and Epping ($747,250). Together with the five under $700,000, that makes 11 suburbs.
Which Melbourne suburb under $800k has the highest long-run growth?
Frankston North, with average annual growth of 6.78% and 12-month growth of 14.40% on a $715,000 house median. It is also a smaller market, at 127 sales, with a low 2021 median household income of $1,137 a week.
Why is Sunshine West not on the list despite 12% growth?
Sunshine West houses rose 12.14% over 12 months, but their average annual growth is 2.47%, below our 4% test, and houses take 32 days to sell. One strong year on a weak long-run record is not a trend.
Can first home buyers compete with investors under $800k?
Yes. Every house in this post sits below the $950,000 Victorian capital-city price cap for the Australian Government 5% Deposit Scheme, so investors are bidding against first home buyers who need only a 5% deposit.
Abora is Australia's leading AI-powered property technology startup, and in Melbourne's busiest price bracket our job is to put a suburb's long-run record beside its latest year, so one is never mistaken for the other.
This content is for informational purposes only and does not constitute financial, investment, legal, or tax advice. Property investment involves risk, including potential loss of capital. Past performance is not indicative of future results. Market conditions can change rapidly. Always conduct your own due diligence and consult a licensed financial adviser, accountant, or solicitor before making any property investment decision.
Sources
- Your Investment Property Magazine (CoreLogic data)2026-09-12
Kurunjang houses: median $615,000, quarterly growth 2.50%, 12-month growth 13.68%, average annual growth 6.45%, gross yield 3.74%, median weekly rent $430, 20 days on market, 209 sales. Owner-occupied homes 74.50% (2021).
- Your Investment Property Magazine (CoreLogic data)2026-09-12
Melton West houses: median $616,500, 12-month growth 11.18%, average annual growth 4.79%, gross yield 3.80%, median weekly rent $430, 22 days on market, 186 sales. Owner-occupied homes 73.80% (2021).
- Your Investment Property Magazine (CoreLogic data)2026-09-12
Meadow Heights houses: median $680,000, quarterly growth 0.00%, 12-month growth 8.54%, average annual growth 5.41%, gross yield 4.21%, median weekly rent $530, 29 days on market, 147 sales. Owner-occupied homes 65.30% (2021).
- Your Investment Property Magazine (CoreLogic data)2026-09-12
Werribee houses: median $660,000, 12-month growth 6.97%, average annual growth 4.10%, gross yield 3.65%, median weekly rent $470, 27 days on market, 1,056 sales.
- Your Investment Property Magazine (CoreLogic data)2026-09-12
Hoppers Crossing houses: median $700,000, 12-month growth 10.64%, average annual growth 4.38%, gross yield 3.71%, median weekly rent $480, 26 days on market, 640 sales. Owner-occupied homes 71.20% (2021).
- Your Investment Property Magazine (CoreLogic data)2026-09-12
Frankston North houses: median $715,000, 12-month growth 14.40%, average annual growth 6.78%, gross yield 3.93%, median weekly rent $520, 24 days on market, 127 sales. Median household income $1,137 per week and owner-occupied homes 52.20% (2021).
- Your Investment Property Magazine (CoreLogic data)2026-09-12
Pakenham houses: median $720,000, 12-month growth 7.46%, average annual growth 4.95%, gross yield 4.05%, median weekly rent $570, 14 days on market, 980 sales.
- Your Investment Property Magazine (CoreLogic data)2026-09-12
Craigieburn houses: median $723,000, 12-month growth 6.32%, average annual growth 4.29%, gross yield 4.03%, median weekly rent $550, 30 days on market, 1,033 sales.
- Your Investment Property Magazine (CoreLogic data)2026-09-12
Cranbourne houses: median $723,500, 12-month growth 7.97%, average annual growth 5.07%, gross yield 3.99%, median weekly rent $550, 17 days on market, 383 sales.
- Your Investment Property Magazine (CoreLogic data)2026-09-12
Hampton Park houses: median $730,000, 12-month growth 8.96%, average annual growth 4.73%, gross yield 4.05%, median weekly rent $560, 19 days on market, 376 sales.
- Your Investment Property Magazine (CoreLogic data)2026-09-12
Epping houses: median $747,250, 12-month growth 8.83%, average annual growth 4.06%, gross yield 3.93%, median weekly rent $550, 29 days on market, 430 sales.
- Your Investment Property Magazine (CoreLogic data)2026-09-12
Sunshine West houses: median $785,000, 12-month growth 12.14%, average annual growth 2.47%, 32 days on market, 232 sales.
- Your Investment Property Magazine (CoreLogic data)2026-09-12
St Albans houses: median $730,500, 12-month growth 10.68%, average annual growth 2.62%, 34 days on market, 444 sales.
- Your Investment Property Magazine (CoreLogic data)2026-09-12
Sunbury houses: median $720,000, 12-month growth 7.78%, average annual growth 2.87%, 15 days on market, 894 sales.
- Your Investment Property Magazine (CoreLogic data)2026-09-12
Doveton houses: median $654,500, average annual growth 3.52%, gross yield 4.21%, 24 days on market, 170 sales.
- Your Investment Property Magazine (CoreLogic data)2026-09-12
Tarneit houses: median $671,750, 12-month growth 2.56%, average annual growth 3.16%, 49 days on market, 1,695 sales.
- Housing Australia
Australian Government 5% Deposit Scheme property price cap for Victoria: $950,000 for the capital city and regional centres, $650,000 for other areas. Both purchase price and lender-assessed value must be at or below the cap.
- Cotality2026-09-01
Melbourne home values fell 1.1% in August. 93% of capital city suburbs recorded a value decline through winter. The gap between weaker expensive housing and lower-priced housing has narrowed as the downturn broadens.
- Property Investment Professionals, reporting the Cotality Home Value Index
Melbourne dwelling values: -1.1% in August 2026, -3.9% over three months, -4.7% over 12 months; median dwelling value $786,718.
- Property Investment Professionals, reporting the Domain House Price Report
Melbourne median house price fell 3.1% over the June quarter 2026 to $1,041,205.