Metropolitan vs Rural Victoria: Where Is the Growth in 2026?
The headline most people miss
Property news loves a Metro-vs-Rural narrative. The honest answer is more interesting: Frankston and Greater Geelong urban houses are running at almost the same 12-month pace. The City of Greater Geelong is now the state's #2 builder by permit count, ahead of every metropolitan council except Wyndham. And Cotality just placed Regional Victoria as the weakest regional state in 2025, not the strongest.
TL;DR
Key takeaways
- Greater Geelong urban houses sold at a 12-month median of $700,000 (n=2,464); Frankston $850,000 (n=600).
- 10-year capital growth is nearly identical: Frankston +99%, Greater Geelong urban +93% (Land Victoria, 2014–2024).
- Building permits in the last 12 months: Metropolitan VIC 17,783, Rural VIC 7,977 — but City of Greater Geelong alone (classified Rural) was the second-largest issuer in the state.
- Cotality's Jan 2026 view: Regional Victoria managed +6.0% for 2025 — the lowest of any rest-of-state region — while combined capitals ran +8.2%. The 2026 outlook is "less optimistic than 2025."
- Pick on the actual property and your own preferences. The Metro / Rural label is doing less work than people think.
What's happening right now
Two things are true at once. First, regional Australia did genuinely outperform capitals in 2025 — Cotality has regional dwelling values up 9.7% for the year vs 8.2% for combined capitals. Second, Regional Victoria specifically was the laggard among the regional states, posting just +6.0%. So if your mental model is "regional = growth", refine it: regional Queensland and WA were the standouts; regional Victoria played catch-up after the 2023–24 correction.
Inside Victoria, the picture has its own texture:
- Melbourne metro finished 2025 at +4.8% dwelling value growth — the mildest capital-city gain — and recorded its first month-on-month dip since January 2025 in December.
- Regional Victoria as a whole sat at +4.5% annually to October 2025, with a 62% of regional VIC markets now in positive classifications (up from 58% three months earlier per Smart Property Investment).
- The RBA cash rate sat at 3.85% in early 2026 after a +0.25 pp lift, with the central bank flagging that housing growth had moderated. Higher-for-longer rates explain a lot of the 2026 caution.
The data behind the trend — Frankston vs Greater Geelong
Picking two real anchors makes this concrete. We define Greater Geelong urban as postcodes 3214, 3215, 3216, 3218, 3219, 3220, and 3221 — the core urban suburbs around the CBD (Geelong, Geelong West, Newtown, Belmont, Highton, Grovedale and neighbours). Frankston is the single suburb. Both are coastal, both are commutable to Melbourne, both have a lot of working families.
Sold prices, last 12 months (Abora):
- $850,000 (n=600)
- House median
- $700,000 (n=2,464)
- $560,500 (n=246)
- Unit median
- $475,500 (n=426)
- $743,000 (n=66)
- Townhouse median
- $652,500 (n=212)
Frankston carries a roughly $150k house premium over Greater Geelong urban — close to the Melbourne-vs-regional gap you'd expect.
Quarterly trajectory (Abora property data, house medians):
House price trajectory — Frankston vs Greater Geelong urban
Frankston +13.5% YoY · Greater Geelong urban +13.3% YoY
- Frankston
- Greater Geelong urban
Source: Abora property data, house medians — quarterly trajectory.
Frankston's house median rose +13.5% YoY, Greater Geelong urban's +13.3% — within statistical noise.
10-year story (Land Victoria yearly series): Frankston went from $372k (2014) to $740k (2024) — +99%. Greater Geelong urban went from $428k to $827k — +93% (per Land Use Victoria, 2024). The Geelong-area level is higher; the growth is essentially the same.
Building permits, last 12 months (Abora):
- Metropolitan VIC: 17,783 permits, 13,586 new dwellings, 1,912 demolitions, average estimated cost ~$5.0M per permit.
- Rural VIC: 7,977 permits, 3,573 new dwellings, 273 demolitions, average ~$754k per permit.
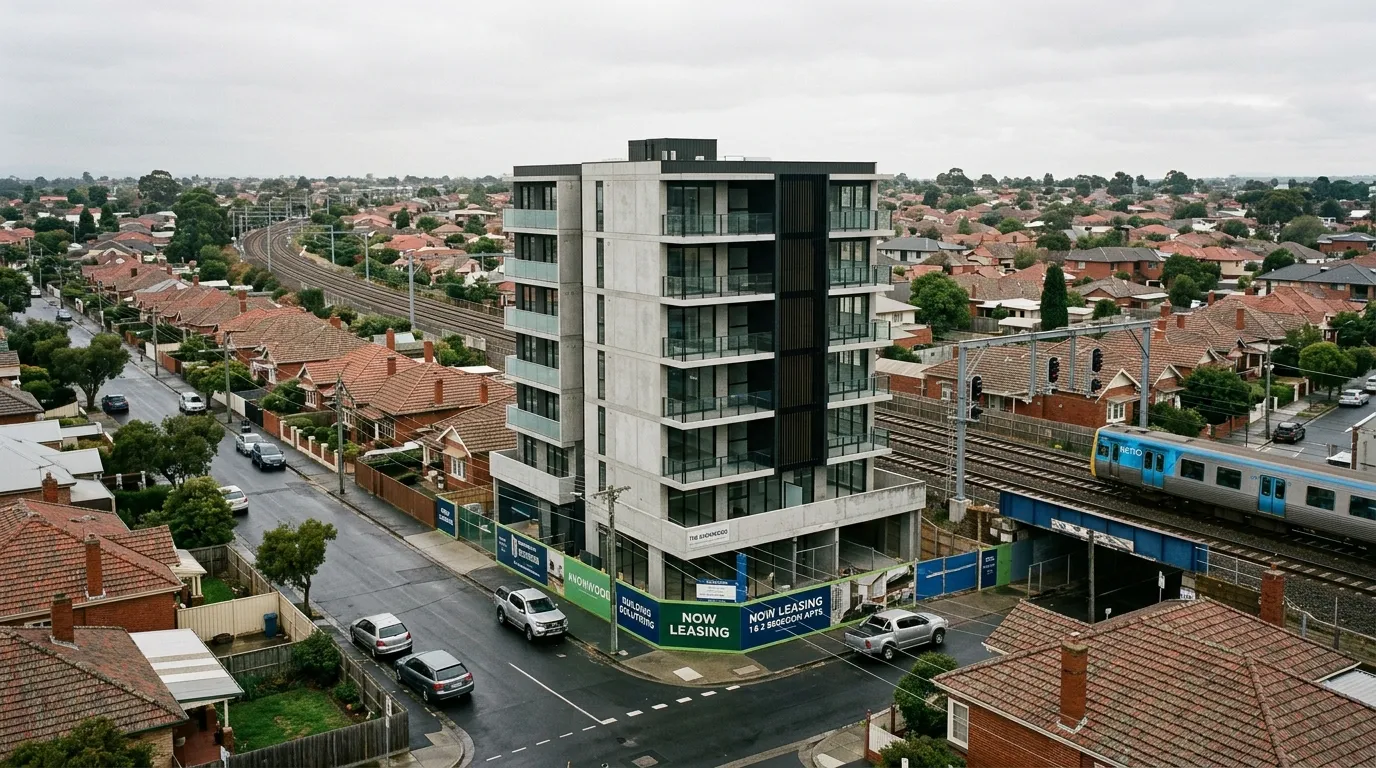
The headline numbers favour metro by 2:1 on permits. But look at the demolition column: metro is knocking down seven times more dwellings than rural — that's densification, not pure growth. And drilling down by municipality: City of Greater Geelong issued 1,412 permits in the last 12 months — second only to City of Wyndham (1,490). City of Frankston issued 313. Greater Geelong, classified "Rural" in the dataset, is one of the state's biggest building stories.
Who lives where (ABS 2021 Census via Abora)
Frankston: 37,329 people, median age 39, household weekly income $1,387 (Vic median: $1,759). Tenure: 25.7% owned outright, 32.6% mortgaged, 39.1% rented. Rental stress affects 39.3% of renters. Public transport carries just 3.1% of commuters (per ABS 2021 Census).
Greater Geelong urban core (Geelong CBD locality): 5,812 people, median age 40, household weekly income $1,670. Owned outright 33.3%, mortgaged 20.3%, rented 43.9%. Renter-heavy and apartment-heavy (25.3% apartments) compared to Frankston (6.1%). Move out one ring to Highton and the picture shifts: $2,054 weekly income, 38.2% mortgaged, owner-dominated (per ABS 2021 Census). Abora's suburb intelligence summarises Geelong as a "Diverse Urban Hub" (Above Average income, Renter-heavy) and Highton as an "Established Family Suburb" (Above Average, Owner-dominated).
Translation: "Greater Geelong" is not one market. The CBD locality acts like an inner-Melbourne pocket; Highton acts like a Melbourne mortgage-belt suburb. Frankston is closer to the Highton profile than to the Geelong-CBD one.
How Abora scores this
Abora's
locationscore weighs macro location quality — distance to CBD, transport corridors, suburb desirability proxies. For the Metro-vs-Rural decision, this is where the gap shows up most: Frankston is on the Frankston train line into the Melbourne CBD; Greater Geelong urban is a 60–75 minute V/Line trip. If your work, family, or social anchors are in central Melbourne, no amount of better house pricing in Geelong will outscore Frankston's location dimension for you.
Abora's
valuescore weighs whether a property is fairly priced against comparable recent sales in the area. For Greater Geelong urban houses at a $700k median vs Frankston at $850k — both growing at the same 13% YoY pace — thevaluedimension can swing strongly in Geelong's favour for the same brief, particularly if you don't need daily Melbourne CBD access.
Abora's
riskscore weighs hazards and planning controls. Frankston and Greater Geelong both score moderately on coastal risk; the more practical risk for 2026 buyers is the macro one (RBA rates, the Cotality "less optimistic" outlook), which Abora'sriskdoesn't capture directly — that's a portfolio-level call.
Common counter-arguments / risks
What to watch in 2026
- RBA cash rate trajectory. A surprise cut would benefit Greater Geelong urban (more rate-sensitive at the affordable end) more than Frankston. A surprise hike would hurt both.
- Greater Geelong's permit pipeline turning into completions. Today's 1,412 permits become 2027–28 supply. Watch for any softness in median price as that supply lands.
- Frankston supply at 0.74 months per HtAG. Below ~2 months is a sellers' market — if it loosens, the 13% YoY growth rate softens fast.
- Yield-driven regional cities (Bendigo, Mildura, Shepparton, Horsham) per API Magazine — a different play from Frankston/Geelong, with house medians under $500k and yields 5%+.
FAQ
Is regional Victoria a better investment than Melbourne in 2026? Not better, just different — Cotality has regional VIC at +6.0% for 2025 (the weakest regional state), Melbourne at +4.8%, and both forecast to slow in 2026.
Why is Greater Geelong classified as Rural in some datasets? It sits outside the Greater Melbourne Capital City Statistical Area, so the ABS and Abora's permit dataset group it Rural — even though it's the state's #2 building municipality.
Frankston or Geelong for capital growth? Almost tied over 10 years (Frankston +99%, Greater Geelong urban +93% per Land Victoria); Frankston pulled slightly ahead in the last 12 months and runs tighter supply.
Where are the highest yields in regional Victoria? Bendigo, Mildura, Shepparton, and Horsham — yields above 5% on house medians under $500k, per API Magazine. Geelong and Ballarat are growth plays, not yield plays.
Has the "tree change" wave reversed? No — cooled but not reversed; Greater Geelong took 9.3% of national net migration to regions in the year to March 2025.
How does Abora help me decide? It scores both suburbs across the same eight dimensions, then re-weights by your preferences — run them through Compare to see the trade-off in your own numbers.
This content is for informational purposes only and does not constitute financial, investment, legal, or tax advice. Property investment involves risk, including potential loss of capital. Past performance is not indicative of future results. Market conditions can change rapidly. Always conduct your own due diligence and consult a licensed financial adviser, accountant, or solicitor before making any property investment decision.
Sources
- Australian Bureau of Statistics2022-06-28
2021 Census QuickStats — used for population, age, income, and housing tenure for Frankston and Greater Geelong localities (queried via Abora's suburb_demographics)
- Victorian Building Authority2025-12-01
Building permit dataset — Metro vs Rural permit counts, new dwellings, and demolitions over the last 12 months (queried via Abora's building_permits)
- Land Use Victoria2025-06-01
Median property price series 2014–2024 — used for Frankston vs Greater Geelong urban 10-year house median (queried via Abora's land_vic_medians)
- Cotality (CoreLogic)2026-01-01
Regional markets +9.7% in 2025 vs combined capitals +8.2%; Regional Victoria +6.0% (lowest of the regions); Melbourne +4.8%; outlook 'less optimistic than 2025'
- Smart Property Investment2026-01-07
62% of Regional Victorian markets have positive classifications, up from 58% three months prior; standout LGAs: LaTrobe Valley, Baw Baw, Bendigo, Geelong, Ballarat, Shepparton, Mitchell
- OpenAgent2025-12-12
Regional Victoria median dwelling value ~$600k; +4.5% annually to October 2025; gross rental yields 4.3%; growth skewed toward affordable end
- HtAG Analytics2026-02-01
Frankston market: median house price ~$835k, +13.37% annual growth; 16 days on market; 0.74 months of supply
- API Magazine2025-11-15
Bendigo and Mildura: tight vacancy and yields exceeding capital city averages; Shepparton median $455k with 5.8% yield; Horsham +14.1% annual growth and 5.2% yield
- Reserve Bank of Australia2026-02-01
Cash rate at 3.85% as of early 2026 (lifted +0.25 percentage points); housing market activity grew strongly over the past year, moderated at the start of 2026
- Loan Market Geelong2026-01-01
Geelong population forecast to reach ~400k by 2046 from ~300k in 2025; Highton, Belmont, Torquay flagged as growth pockets; Fast Rail cited as supporting infrastructure
Run the comparison on your own brief
The Metro-vs-Rural label is doing less work than the headlines suggest. The two suburbs that anchor this post move at almost the same rate, with very different price points and very different commute realities. Your right answer depends on what you weight.
Compare Regional SuburbsOr open Discover and score live listings in Frankston and Geelong against your own preferences.